Author: John Dolce

John Dolce has not set their biography yet

15 Tips for Improving Your Inventory Control

For some, the term “inventory control” may seem more like an oxymoron than a management practice. If you feel like your inventory is anything but controllable, here are 15 tips to help you better manage the process, thereby creating added success and profitability for your fleet.

Tip 1: Implement and Enforce an Inventory Control System
Every parts operation needs an inventory control system of some sort, which should incorporate the following key elements:
• It must warn parts personnel far in advance that a part is being depleted from stock.
• It must list a part’s historical purchase price so that if the price changes, the
manager will be able look into the issue and ascertain whether this change is a price increase or due to incorrect billing.
• It should list vendors that offer the best prices.
• It should give past usage rates so that the manager can determine proper inventory
levels.
• It should require as little writing as possible, particularly by mechanics.

Tip 2: Know Your True Total Demand
Total demand is a complete record of all filled orders and actual parts delivered to customers regardless of the source. In addition to filled orders, a complete and total record of all lost sales – those sales that never occurred due to lack of inventory – must be kept.

A total demand record helps to reveal the changing and flexible nature of the marketplace and aids you in stocking the right parts in the right quantities at the right time.

Tip 3: Define Your Economic Order Quantity
The economic order quantity equation helps define the optimum inventory order amounts by factoring in the cost and demand of that inventory. Your goal should be to make as few orders as possible while also maintaining the proper inventory.

The cost of writing a purchase order and of paying the bill varies between approximately $35 and $50 per transaction. Considering this high cost, a target minimum of $500 of inventory per month should be purchased from each vendor. Placing an order for a smaller amount of merchandise creates a disproportionate and uneconomical clerical expense. If only a small amount of stock is ordered each month, good prices for those items will not offset the cost of paperwork.

Tip 4: Reduce Your Carrying Costs
The carrying costs of inventory can be between 30 and 40 percent of the total inventory value. You should have an ongoing strategy for reducing the costs of:
• Rent or proportionate building depreciation; building maintenance and repair; utilities; and labor costs for janitorial staff and security guards.
• Inventory storage and material-handling equipment.
• Taxes.
• Insurance.
• Inventory personnel salary and benefits.
• Damaged and nonreturnable parts, pilferage, warranty claim time and returning parts.
• Lack of return on inventory and control investments that might otherwise produce income.

Tip 5: Establish a Formal Warranty Program
Each premature component failure due to a supplier vendor providing poor workmanship, poor materials, and/or any latent defects should be flagged by fleet management and inspected by the vendor. Once inspected, the vendor can make a decision about the fleet’s claims about the component. The vendor should provide a monthly inspection that includes an agreed-upon settlement and a credit to the fleet. These parts failures have costs, and it is important that you set your ceiling for recovery at 5 percent of the dollars spent with that vendor. Should reclamation be more than 5 percent, begin exploring alternative vendor solutions.

Tip 6: Start with Big-Ticket Inventory Items
In evaluating big-ticket items or items with an aggregate targeted shelf inventory value of at least $5,000, limit your inventory to the amount needed for a 90-day period. If these items can be purchased locally within one or two days, it may not be necessary to stock them at all, especially if the repair requires one or several days of preparation work before the part is needed.

Make sure you weigh the cost of keeping big-ticket items in stock against the cost of customer out-of-service times. You may find that limited out-of-service times are more economically sound than maintaining inventory of relatively expensive items.

Tip 7: Invest in Your Brain Power
If a large inventory is your only solution to create a high level of vehicle availability, you will be hard-pressed to find ways to reduce inventory costs. The reality is that you must be consistently vigilant at keeping your inventory as lean as possible. The more you learn about the parts inventory business model, best principles and practices, successful analysis and applied corrective strategies, the better you will be at effectively planning a successful inventory strategy.

Tip 8: Don’t Confuse Price with Cost
Too often, price and cost are used interchangeably and in error. Price is what you pay in dollars to acquire a product or service. Cost takes into consideration all the factors that add up to return on investment. Ease of installation, frequency of service, labor required and safety are only a few of the considerations in determining cost. In essence, if you are to justify the high initial price of a product, you will have to do so based on cost. Make sure you analyze and understand all of the costs of your operations prior to beginning any inventory strategy.

Tip 9: Require Vendor Guarantee of On-Time Delivery
Don’t resort to expensive stockpiling of key materials in order to avoid inventory shortfalls
caused by late delivery of parts by suppliers. Instead, put the burden of responsibility for
prompt delivery on suppliers – where it belongs. One way to do this is to guarantee the vendor a minimum monthly purchase in exchange for the vendor promising both on-time delivery as well as a penalty payment if you have to purchase materials on the spot market to fill a gap when a delivery is late. The penalty payment should be equal to the cost you expended to obtain the materials.

Tip 10: Negotiate, Negotiate, Negotiate
When mounting an effort against waste in inventory handling, a manager should first consider the company’s purchasing policies and past experience with parts suppliers. Are the prices the lowest possible? If lower prices can be negotiated elsewhere based on volume, will service and delivery remain acceptable? It is futile to negotiate with no idea of realistic costs or possible price reductions. Therefore, purchasing guidelines must be established early in negotiations by someone familiar with parts-pricing discounts.

Tip 11: Brand Loyalty Doesn’t Pay
Negotiations should not be brought to a standstill by a fleet manager’s insistence on one
and only one brand of a part. In virtually every area, there are competitive lines available. This
can be a negotiation advantage. For example, if one line is not available at a jobber price – which is usually between the MSRP and warehouse distributor price – perhaps a competitive brand would be. Flexibility in this aspect can be profitable.

Tip 12: Don’t Overlook the Small-Ticket Items
Bolts, nuts and other similarly sized shop supplies constitute an often-neglected expense that can be significantly reduced. A common mistake on the part of managers is thinking that nuts and bolts are small-ticket items. In fact, such supplies will generally account for around 8 percent of the total parts bill each month. Much of this expense is waste attributable to poor purchasing habits. For instance, if you purchase these expendables from a salesperson who offers free bolt bins and other inducements to buy, you might be paying two to five times more than you should for these supplies. Even though they may be easy to overlook, it’s important to be aware of the cost of these materials.

Tip 13: Do Your Pricing Homework
If you don’t have an ongoing method for checking parts prices, you’ll have a hard time creating inventory efficiency. You should always have the latest price sheets from all the vendors with whom you do business.

As merchandise is received and volume changes, the prices on several items should be spot-checked to make certain the proper discounts are in effect. Without this monitoring, you will miss pricing and discount mistakes made by the vendor. To reduce any confusion over agreed-upon pricing, deal with one designated representative from each vendor whenever possible.

Tip 14: Plan Ahead for Hard-to-Get Parts
Availability of hard-to-get parts can obviously present problems, but longer delivery times shouldn’t necessarily preclude the use of a particular vendor. For instance, a part might be available locally at a cost of 20 percent greater than an out-of-town vendor would charge. If the part is ordered from the local vendor, delivery would require only a few days while the other supplier would need two weeks to deliver the part. However, given the substantial cost savings, it would be better to use the out-of-town vendor and simply stock an extra two weeks’ supply of the part.

Tip 15: Keep the Old Inventory Cycle Going
Simply put, old inventory needs to be removed from the parts room. A formal inventory should be taken every six months. Items that have not been used in those six months should be taken off the shelves, assuming that a system of cycle counting – frequent, random sampling of inventory line items – is not being used.

About the Author: John Dolce is a fleet facility and maintenance specialist employed by Wendel Companies, an architectural and engineering firm. He is an active consultant, instructor and fleet manager with more than 40 years of experience in the public and private sectors. Dolce has written three fleet-related textbooks and teaches fleet management courses at the University of Wisconsin’s Milwaukee and Madison campuses. He can be contacted at johnedolce@yahoo.com.

Fix That Money Drip

Fleet managers who develop objective, fact-based, data-driven decision-making processes often are successful because they don’t let emotions, irrational estimations or surface-level perceptions factor into their decisions.

Unfortunately, when it comes to properly staffing a fleet’s maintenance and repair teams, some managers waste valuable budget dollars by making shoot-from-the-hip decisions without taking time to drill down into the data to uncover facts that can help steer them toward more financially efficient, prudent paths.

This mistake can have a serious impact on the bottom line because, on average, maintenance and repair expenses can account for as much as 25 percent of annual fleet costs. This is why it is so important that you make sure you allocate every maintenance- and repair-staffing dollar wisely.

Needs Analysis as a Starting Point
On average, fleet professionals perform approximately 500 different maintenance and repair tasks on their vehicle and equipment fleet. When considering adding staff to your maintenance and repair team, you will have to determine whether or not you want new employees to have the skill sets needed to complete some or all of those tasks.

Look at the costs associated with hiring industry workers with varying degrees of skill sets. Salary amounts can range depending on what skills you want your employee to have, whether or not he or she has a professional certification, experience level and where you are located within the U.S. When you research salaries, you also are likely to discover the size of the talent pool you have to recruit from in your area.

True Productive Time and Its Impact on Value
Another mistake some fleet managers make is believing that hiring a full-time maintenance and repair worker who works eight hours a day, five days a week for 52 weeks a year will provide a value of 2,080 total hours of productive work.

A value investor does not make decisions based on this type of surface data; you must dig deeper to find the true value. First, factor in holidays, sick leave, vacation hours, jury duty, outside training and personal days, all of which is time not spent on maintenance and repair tasks. On average, these days away from the bay add up to about 580 hours per year. So, the actual work time is now down to 1,500 hours.

Next, add in on-the-job, at-work, indirect time. This is a term for the nonproductive time when staff members are engaged in administrative work and other tasks that remove them from their bays, such as ordering parts, completing paperwork and pre- and post-trip reports, taking coffee breaks and attending meetings. It’s non-wrench-turning time, and it typically accounts for 500 hours a year, which brings the total down to 1,000 hours a year of wrench-in-hand productivity.

Now dive deeper into those 1,000 hours to establish their true productive work time value. Of the 500 tasks that the maintenance and repair staff performs, only 5 percent are performed on a repetitive, continual basis. This 5 percent makes up an estimated 30 percent of their workload and consists of tasks like replacing batteries, changing oil and so on.

The good news is that these are the tasks from which you’re truly going to get one hour of productive work out of a one-hour job. That’s because workers benefit from the repetition – it increases their task efficiency and skills. In other words, the more they perform the tasks, the better they get at them. So, of the 1,000 hours, there will be 300 hours of high-value, productive work.

But this means that the other potential tasks will take up 70 percent – or 700 hours – of their workload. These tasks can slow productivity because they are more challenging and haven’t been retained in employees’ muscle memory. As a result, a one-hour task could take double, triple or even quadruple the time to complete.

On average, this drop in productivity reduces the 700 hours to about 400 hours of high-value, productive work time. Now we see that a full-time employee is going to give us a total of approximately 700 hours of maintenance and repair value – 300 hours performing repetitive tasks and 400 hours engaging in tasks that are less frequently performed.

Let’s do the math. Seven hundred productive hours is about a third of 2,080 full-time hours. That means that in the case of a $20-per-hour employee, you really are paying $60 for each productive hour.

When you add in benefits at an estimated $8 per hour, and also add in facility costs – including amortization of the floor space, heat, electricity, clerical times and everything else in that category – the actual figure gets close to $95 to $100 per hour.

Doing this calculation not only shows the value you are getting from your existing maintenance and repair staff, but also provides more revealing data about what it costs to hire new staff. How do these numbers stack up against the available outsourcing options? And where can you find other sources of value in your in-house staff that will help you lower that $95- to $100-per-hour cost?

You certainly can look at your existing staff and assess some of the intrinsic value in them, such as the efficiency and quality of work that is a result of their experience. You can also look at the cost of replacement for those workers. Finding a new worker to replace a good, reliable employee that you’ve properly trained can become a very time- and dollar-consuming task.

If you keep these concepts in mind when you make investment decisions, you’ll be much better equipped to put your organization in the best position possible to minimize its vehicle and equipment maintenance and repair outlays, maximize its vehicle availability, minimize your fleet size and maximize your fleet utilization – which adds up to lowering your fleet’s overall billable costs without reducing productivity.

About the Author: John Dolce is a fleet facility and maintenance specialist employed by Wendel Companies, an architectural and engineering firm. He is an active consultant, instructor and fleet manager with more than 40 years of experience in the public and private sector. Dolce has written three fleet-related textbooks and teaches fleet management courses at the University of Wisconsin’s Milwaukee and Madison campuses. He can be contacted at johnedolce@yahoo.com.

Dolce-1-Web

Driving Toward Discounts: How Telematics is Reshaping the Auto Insurance Marketplace

Here’s a pop quiz for you: Driver A is a 17-year-old single male who conservatively drives his car a total of 12 miles a week to and from his high school. Driver B is a 52-year-old married female who aggressively drives her car 500 miles a week to and from her late night/early morning job at a restaurant. Both have perfect safety records and no traffic violations. Who is likely to have the more expensive vehicle insurance premium?

With a traditional insurance plan, Driver A would more than likely have the higher premium. This is based on the fact that the risk data that insurance companies use to calculate premium rates indicates that young, inexperienced, single male drivers are more likely to get into accidents.

However, the reality is that Driver B is the higher-risk driver. She drives during the most dangerous hours of the day. She’s an aggressive driver. And she drives a considerable number of miles.

This is where usage-based insurance plans – also referred to as pay-as-you-go plans – come into play. By installing telematics devices in vehicles to gather more accurate risk data, insurance companies are now setting personalized rates based on individual driver activities, behaviors and actions. They look at a number of risk indicators, including:
• How often a driver slams on the brakes.
• How many miles a driver drives.
• The time of day a driver drives.
• How often a driver speeds or drives aggressively.
• Whether or not a driver uses a phone while driving.
• How long a driver drives without taking breaks.

Telematics insurance products have been available in the U.S. for a number of years, and their future popularity is projected to skyrocket. According to a study by ABI Research, telematics insurance will see a massive boost in popularity – growing from 5.5 million subscribers at the end 2013 to approximately 107 million subscribers in 2018.

With constant advances in technology added to vehicles at both the OEM and aftermarket levels, it is safe to say that usage-based plans may soon become the insurance industry standard.

About the Author: John Dolce is a fleet facility and maintenance specialist employed by Wendel Companies, an architectural and engineering firm. He is an active consultant, instructor and fleet manager with more than 40 years of experience in the public and private sector. Dolce has written three fleet-related textbooks and teaches fleet management courses at the University of Wisconsin’s Milwaukee and Madison campuses. He can be contacted at johnedolce@yahoo.com.
Fleet Telematics: Technology on the Move

When it comes to onboard vehicle technologies, it is easy to forget how far we’ve come in such a short period of time. We’ve advanced from rudimentary tachographs and not-always-reliable engine control modules to globally connected, high-tech telematics that provide real-time data and automated maintenance solutions.

Before the telematics boom, many of us looked to those little black boxes installed in vehicles that monitored oil, coolant and fuel levels, engine temperatures and pressures, fan usage and exhaust emissions.

As that monitored data changed, the black box would automatically adjust and optimize engine performance to maximize performance efficiencies. Should the engine experience a performance problem, the data would be stored to a central fleet user function and the little black box would alert the driver to the mechanical issue. The device would also put the engine in “limp-in mode” to help reduce added mechanical failure while at the same time giving the driver the ability to get the vehicle to a location to be serviced without exacerbating the failure.

However, as any fleet manager who used those pre-telematics technologies would likely tell you, the technology was far from refined and had its fair share of bugs. Issues with consistency and reliability were common, which made it even more difficult to justify the technology costs. It would take several years for the technology to advance enough to provide more reliable and comprehensive fleet management solutions that fully mitigate the expense.

When the federal government opened up GPS satellites to civilian use in the mid-1990s, we saw real, meaningful growth in telematics technologies.

By the mid-2000s, telematics technologies had grown to feature theft-deterring automatic shutdowns, remote fuel usage monitoring and vehicle operation tracking – all providing cost- and risk-reducing solutions that helped fleet managers project fuel costs, schedule OEM maintenance, and decrease insurance and vehicle replacement costs. Yet, even with those advancements, telematics systems were still hindered by a lack of available vehicle data and fast, reliable mobile data delivery.

Modern Technology
Today’s telematics are now more akin to the technology found in modern aircraft. OEMs have begun building in more advanced vehicle performance tracking ability by adding new hardware and more direct-wired sensors to vehicles. Additionally, high-speed mobile data technology has become a dependable and affordable solution.

Now, telematics systems can provide global access to real-time vehicle location and activity data, automated logging, mobile workforce tools, camera integration and more. With ongoing real-time engine performance monitoring, maintenance planning can shift from the utilization of vehicle usage milestones to condition-based maintenance.

And should urgent repairs be needed, telematics can improve the efficiency of the process. By automatically alerting your maintenance team or local dealership about the required repair before the vehicle arrives, a bay can be open and waiting with the necessary maintenance crew members and parts when the vehicle pulls in to the lot.

The value of telematics extends to fieldwork performance as well. Lifts and digger derricks depend on properly inflated tires as an integral part of their stability systems. With tire pressure-sensing technologies, workers can quickly assess whether or not tire air pressure is at safe levels, and then correct any issues prior to beginning work. Furthermore, dispatch has more data to work from to reduce fuel costs and maximize productivity.

Telematics Implementation Tips
Telematics has provided the ability to support safe work methods, lower maintenance costs and extend vehicle life cycles. However, it is vital that any fleet management professional approach a new telematics implementation with a thorough understanding of how to maximize its value and offset its impact on the bottom line. Following are five tips to help ensure your telematics implementation is successful.

1. Build extended warranties into the management process.
Implementing a new technology into a business process requires patience and an understanding that wrinkles may need to be ironed out along the way. To account for this, make sure you build sufficient warranty periods into the purchase.

2. Track value with a cost-benefit analysis.
Telematics systems costs have decreased over the years. For instance, a device that used to run $7,000 per vehicle may now be available for less than $1,000. Regardless, the technology is still a significant investment that needs to be justified. Make sure you keep records of the benefits gained, including thoroughly detailing the performance, maintenance and efficiency improvements that occur as a result of using the new technology. Don’t forget to factor in the value of increased vehicle and equipment availability and usage benefits.

3. Do your homework by determining internal needs.
There is an abundance of fleet telematics solutions in today’s market. To ensure you choose the best technology for your organization, you need to understand the solutions needs of those who will benefit from its implementation. Recruit leaders from maintenance, dispatch, the field and any other affected department. Get them involved in the selection process by asking them to provide you with the ways they envision the technology will help their respective departments or teams.

4. Think outside the little black box.
When an experienced fleet professional applies his or her innovative, application-specific perspective to a new technology implementation, new ideas often arise about how to maximize its value. Always look for new ways telematics can bring added return on investment. Think beyond the ways the manufacturer suggests you use the solution – within the realm of usage that is covered by the warranty, of course – and find ways to employ the technology for your organization’s specific needs.

5. Make sure users are trained to use the technology – and commit to using it.
The value of any tool can be diminished when it is not used properly or not used at all. Make sure all users of your telematics are thoroughly trained on how to maximize their value, and also ensure that users commit to capitalizing on that value by continuously using the tools. The best way to accomplish this is by taking time to explain the ways the technology will benefit them professionally as well as how the organization as a whole will benefit.

By proving the value of telematics and establishing its return on investment, you will have more success dealing with political and cultural resistance to the new technology within the fleet structure.

About the Author: John Dolce is a fleet facility and maintenance specialist employed by Wendel Companies, an architectural and engineering firm. He is an active consultant, instructor and fleet manager with more than 40 years of experience in the public and private sector. Dolce has written three fleet-related textbooks and teaches fleet management courses at the University of Wisconsin’s Milwaukee and Madison campuses. He can be contacted at johnedolce@yahoo.com.
Dolce-1-Web

Struggles and Strategies

To some, spare vehicles are presumed to be extra units that, for the most part, sit idle and therefore have no real cost associated with them. For the unfortunate fleet managers and end users who believe this, they will inevitably find out how inaccurate they are.

A vehicle deteriorates when it sits idle for too long, and spare units kept at an end user’s location are usually idle more of the time than if they are shared with other departments. When it comes time for these vehicles to be put to work, they typically have deteriorated from lack of use – regardless of whether they are stored inside or outside – and are not functional unless serviced to avoid breakdowns. Deterioration can come in the form of rust, corrosion, component cannibalization, lack of preventive maintenance and dead batteries due to parasitic drain from new technology.

So, why would someone keep spare vehicles, particularly when many units that have been replaced with new vehicles are auctioned off, traded in or scrapped? The logic behind keeping spares is that the fleet will have properly configured extra vehicles in the event that they are needed, providing convenience and an alternative to renting units that may be costly and not fully meet the fleet’s needs.

This logic, however, is faulty. If these units were truly capable of functioning as required, why were they replaced instead of having their lives extended? Once vehicles exceed their life cycles, maintenance costs increase, making old units more costly than new ones to own and operate. If a unit has been replaced, it should be removed from service because it does not support reliability, safety or cost-efficiency.

It’s crucial for fleet needs to be reviewed on an annual basis. This assessment gives fleet personnel the opportunity to define and refine the mix of their motor pool as well as determine what units should be removed from the mix due to lack of use. These units typically should not be replaced because if they are not being used, they are not needed. At the same time, if there is an underutilized vehicle in the mix that still has some economic life left, it can replace a unit in the same vocational class that is higher in cost, and that more costly unit can be removed from the fleet inventory.

A Spare Solution
As previously stated, keeping spare units at an end user’s location can result in them being idle more often. This is not the only end user-related obstacle fleet managers run into when addressing spare vehicles.

The reality is that sometimes vehicle replacement programs have politically and culturally powerful end users at the top of the pecking order. Their influence and authority allow them to bend or even break rules that were put in place to keep the fleet running in a cost-effective manner.

As fleet managers, we support these end users who, due to their power and perceptions, still want spare vehicles even though they are idle and costly. In the face of their choices, our vehicle support personnel can only do their best to provide operating and cost information, furnish return-on-investment analyses, and support end users’ work methods in the most fiscally responsible way possible.

It is worth the time spent to educate yourself, your staff and end users about arguably the best use of true spare vehicles (not those units that have been replaced by newer, better vehicles) – making them part of the fleet’s central motor pool. The motor pool usually consists of a number of reliable light-duty and vocational units that are put into service when other, more frequently used vehicles are in need of maintenance or repair, or during peak service times when the workload is greater than usual.

Adding these reliable spare units to the pool has multiple benefits. First, since they are being added to the rotation, they will not sit idle and continue to deteriorate. This leads to lower costs of operation and ownership, as well as greater safety and reliability. Second, fleets will potentially spend less on rental units if they have more vehicles in the central motor pool. And third, if it appears they are no longer needed after three to six months, units can and should be removed from service and cost-effectively disposed of.

It is a good idea for all companies with fleets to take the time to create a written policy that details why and how the company rotates vehicles in a central motor pool, and why and how units should be removed from the fleet. The policy should be signed by the company’s chief operating officer and published for all departments to review and follow.

Changing Times, Changing Technology
Times are changing, and it’s to a fleet’s advantage to adapt to new technology and adopt the most recent best practices, including how to handle spare vehicles. Due to global competition, a vehicle manufactured today is designed to last longer and achieve more miles than one produced 20 to 25 years ago.

The lives of top maintenance and repair components – among others, tires, brakes, steering, air conditioning, starters, alternators, drivelines, engines and transmissions – have also been extended due to better technology. In turn, they are more reliable for greater periods of time in their application-specific environments. Today’s vehicle warranties are also better and longer than in the past, which is further proof the vehicle components are more reliable and last longer.

On top of all that, vehicle maintenance technicians, mechanics and related workers are more highly trained now than ever before. Their input to management continues to improve fleet best practices every day, and we’re seeing repairs we have never seen in the past. For example, it was previously unheard of to replace a vehicle’s hydraulic brake line because the brake lines used to outlive the vehicle. Now, vehicle life cycles are much longer, so many components need to be replaced or have their lives extended, which also extends the cost of the unit beyond its original purchase price.

Today’s fleet service personnel are also highly aware that young vehicles require different services than older vehicles. Mounted equipment needs are different from chassis to chassis and application to application, and usage keeps spares more reliable for longer periods of time and better controls costs.

In summary, spare units should be removed from fleets if at all possible, but if an end user insists on keeping spares, adding them to a central motor pool is the best way to prevent them from becoming idle and unduly costly. The bottom line is that chief executives, fleet personnel, and all departments need to communicate and work together to establish spare vehicle guidelines that best meet everyone’s needs.

About the Author: John Dolce is a fleet facility and maintenance specialist employed by Wendel Companies, an architectural and engineering firm. He is an active consultant, instructor and fleet manager with more than 40 years of experience in the public and private sector. Dolce has written three fleet-related textbooks and teaches fleet management courses at the University of Wisconsin’s Milwaukee and Madison campuses. He can be contacted at johnedolce@yahoo.com.
Dolce 1 300px

Alternative Fuel Options for Fleets

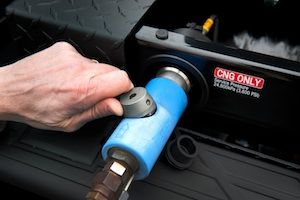
Fleet fueling today is primarily done using gasoline and diesel fuels, which are derived from crude oil and emit carbon dioxide as a byproduct of combustion. For every gallon of gasoline burned, 20 pounds of carbon dioxide are emitted into the air. Diesel emits 22 pounds of carbon dioxide, and propane, the third-most popular world fuel, generates 13 pounds of carbon dioxide. Methane – the primary component of compressed natural gas (CNG) and liquefied natural gas (LNG) – generates a little less than propane, approximately 12 pounds per gallon equivalent.

Until recently, CNG, LNG and propane were more expensive than gasoline and diesel. However, shale gas reserves from the Marcellus, Bakken and Eagle Ford deposits – along with new extraction and fracturing methods – have given the U.S. and Canada the world’s largest natural gas reserves, making the cost of natural gas half the cost of diesel fuel. With this benefit, we can develop strategies to build the cost-effective infrastructure necessary to economically deliver to end users the methane fuels, including CNG and LNG, that will allow us to reduce our dependency on petroleum-based fuels as well as reduce our carbon dioxide emissions.

Conversion Costs and Other Considerations
Converting one diesel engine to use natural gas will cost an estimated $20,000 to $30,000. With lower fuel costs than a gasoline or diesel engine, the financial investment can be recovered in two to three years or 175,000 miles.

The added costs are a product of the spark plug ignition and related vehicle fuel storage and delivery systems necessary to upfit the vehicle’s diesel engine so it burns methane fuel. The emissions systems on EPA-compliant diesel engines (i.e., diesel oxidation catalyst, diesel particulate filter and related system components) are not needed when using methane fuel. However, the exhaust gas recirculation system will be retained and the CNG and LNG engine will comply with the 2002, 2007 and 2010 EPA environmental standards.

Dimethyl ether, a variation of methane, provides a fuel for the diesel engine that does not require a spark plug ignition. Large-capacity truck engines can be fitted with high-pressure direct injection, which uses a small amount of diesel fuel to increase the combustion temperature so the methane will fire in a compression ignition cycle – no spark plug needed. At the present time, smaller diesel engines, in order to be converted to methane (CNG) use, need spark plug systems to operate. LNG currently is a better application for long-haul, heavy-duty Class 8 tractors and vocational trucks.

Off-road diesel-powered units require Tier 4 systems, and buses and trucks require diesel oxidation catalysts and diesel particulate filters. Methane systems eliminate the need for these components and their costs because methane fuel burns cleaner and does not need the exhaust filtration to remain EPA compliant.

When considering a conversion, also think about working with a manufacturer that can supply you with a new alternative fuel vehicle for warranty coverage purposes. It is not desirable for you to convert your present gasoline or diesel engine to an alternative fuel vehicle if you want to preserve your warranty. Additionally, you want to be sure that the conversion is efficient and your expected life cycle is kept intact.

Choosing a Fuel Option
What is necessary to decide on infrastructure to support your alternative fuel choice? If methane gas is available in the street at your facility, you can plan on the installation of a CNG fueling station. Street pressure is around 250+/- psi, and you need to have a compressor plus cooling and filter equipment to bring the methane up to 3600 psi to dispense it into your CNG-equipped vehicle. Dispensing does not require any specialized fueler protective equipment. An estimated cost for a CNG station for a 50-vehicle transit bus and/or vocational truck fleet is $2 million to $3 million. The cost for a 100- to 150-vehicle transit bus and/or vocational truck fleet is an estimated $3 million to $5 million.

LNG or propane is an alternative if you do not have methane in the street. Special dispensing equipment is necessary for LNG since storage temperature is around -270 degrees Fahrenheit, and asbestos gloves and an asbestos apron along with a face mask also are needed due to the low temperature. This protective equipment is required for the protection of the fueler in case of a leak. If you are interested in using propane, do your research to see if it can be trucked into your facility.

Some simple alternative fuel options are biodiesel and ethanol. Biodiesel is a quantity of used or virgin vegetable oil. The desired vehicle and engine manufacturer-approved mix is 20 percent biodiesel and 80 percent diesel fuel. For ethanol, the desired mix is 10 percent ethanol and 90 percent gasoline. More than 10 percent ethanol is corrosive and requires stainless steel components. These alternatives can easily be included in our present infrastructure, but do not reduce the amount of carbon dioxide emitted into the atmosphere.

Vehicles choosing CNG and LNG are restricted in their range of travel because of the lack of infrastructure. These fuels are best used in vehicles and equipment that start from and return to their original domiciles. The same is true with electric vehicles; their travel range is restricted based on charging station availability, plus the batteries are not durable, are very expensive and need greater capacity.

Another decision is whether to engineer vehicles and equipment for a dedicated fuel or to equip them with a dual fuel application, which allows a greater range of operation. Dedicated fuel units offer more economical and green control to management to maximize their strategic and tactical goals and objectives, recovering their conversion costs sooner. Units with centralized fueling keep operating activities simple, offering greater control of unit performance, route dedication, training, maintenance and repairs, and maximum availability for maximum utilization.

Maintenance and Repairs
CNG, LNG and propane vehicles and equipment need regular maintenance and also will need repairs from time to time. Vehicles and equipment usually are serviced in facilities such as garages. Other than biodiesel and ethanol, alternative fuels require facility safety upgrades and modifications to protect the service professionals and support staff who diagnose, maintain and repair alternative fuel vehicles and equipment.

Garages in the southern region of the U.S. have the option of servicing vehicles outside under covered work bays, which allows venting of methane, propane, and hydrogen fumes and vapors. Due to the climate, garages in the northern region of North America don’t have this option. Even if you can work outside, it is much better to service vehicles and equipment indoors because it provides a controlled climate, as well as greater safety and a more productive environment for the service personnel. It’s important to remember, however, that working on CNG, LNG, electric, hybrid and propane vehicles and equipment requires the measurement and ventilation of their fumes and vapors.

Regulatory agencies and insurance companies identify codes that need to be adhered to in the construction of alternative fuel-friendly garages. The fire department is king in these circumstances. Consider the following example of methane leakage. Since the flammable range of methane is 5 percent to 15 percent methane and 85 percent to 95 percent air, fire departments and the National Fire Protection Association recommend that 20 percent of the lower flammability limit be measured for staff protection. The lower flammability limit of methane is 5 percent, so 20 percent of the lower flammability limit is 1 percent methane to be measured. The facility must be equipped with explosion-proof fans to be energized when the lower flammability limit is reached. Similar measurements of electric vehicle batteries’ hydrogen emissions, hybrid batteries, hydrogen from fuel cells and propane all fall under regulatory agency supervision for facility and personnel safety and are integral parts of alternative fuel technology and implementation into your fleet.

Fire drills should be held at the garage on a regular basis. If you have gasoline and diesel vehicles, all windows, doors and exhaust equipment must be closed to smother the fire by withholding oxygen. The alternative fuel strategy is to open all doors and windows to release the fumes. These different strategies require staff training to ensure employees know the difference between audio and visual strobe configuration alarms and warning system alerts. Proper training will enable staff to act appropriately during an emergency, including safely exiting the facility and reporting to the correct gathering stations for attendance purposes.

Recent Popularity
Why are alternative fuels now getting so much attention? North America wants to reduce its dependence on foreign fuels and petroleum products. With the world demanding more fuels through foreign oil, competition for a controlled supply increases prices and restricts demands, resulting in the potential for a down economy. Additionally, greater use of oil increases pollution in the form of hydrocarbons, nitrogen oxide, carbon monoxide and carbon dioxide.

Alternative fuels like CNG, LNG and propane offer cost-effective, greener alternatives. And due to horizontal drilling and hydraulic fracturing in large shale fields located in the U.S. and Canada, natural gas volumes recently have dramatically increased. With this increased volume, prices have dropped so that the diesel gallon equivalent of natural gas has become available at less than half the cost of diesel fuel. As such, there is potential to significantly reduce our vehicle and equipment fuel costs and rapidly stimulate the economy by replacing diesel fuel with natural gas and even producing diesel fuel from natural gas.

CNG, LNG and propane are great alternative fuel options that can supplement and replace our immediate and future needs for gasoline and diesel fuel. LNG offers greater heat content and is more suited for over-the-road Class 8 tractor-trailers and vocational trucks. CNG is better suited for Class 1-7 diesel units, and propane fits Class 1-7 gasoline vehicles. These fuel choices are limited only by the construction of fuel stations; in order to realize their full potential, the country must create infrastructure to allow greater access to alternative fuels.

The availability of methane via North American shale deposits and the hydraulic fracturing process has put the region in a position to use CNG, LNG and propane as productive, cost-effective alternative fuels. Each of us needs to do our homework to see what is best for our specific needs. Analyze the cost of alternative fuels, look at the payback time frame, and make the decision that is best for your shops and your business as a whole.

About the Author: John Dolce is a fleet facility and maintenance specialist employed by Wendel Companies, an architectural and engineering firm. He is an active consultant, instructor and fleet manager with more than 40 years of experience in the public and private sector. Dolce has written three fleet-related textbooks and teaches fleet management courses at the University of Wisconsin’s Milwaukee and Madison campuses.

Dolce-1-Web

Replace, Rebuild or Repair?

How do you complete an economic analysis to cost-effectively determine whether to replace, rebuild, repair, sell or scrap vehicles and equipment? How do you ensure that your choice is the right one made at the right time, and that it supports your fleet’s tactical and strategic operating plans?

To start, you must assure yourself that your fleet’s vehicles and equipment being considered for replacement are fully utilized. If they’re not, instead of replacing them, think about reducing them from the fleet inventory and renting the units as needed. You can measure your fleet operation by laying out figures of activity-based costing to evaluate the facts, which will give you a picture of your fleet’s productivity and profitability.

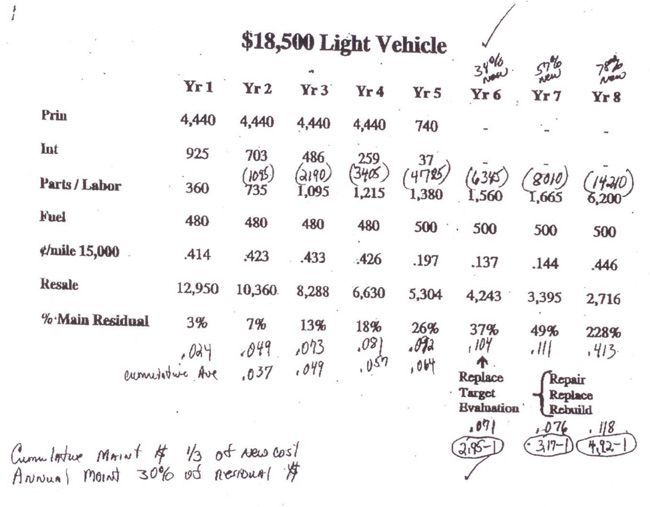
Let’s look at an example of activity-based costing. The chart below shows the eight-year cumulative costs of an $18,500 light vehicle. The seven lines of the chart reflect the following:
• Line 1: Principal of $18,500 spread (depreciated) over five years.
• Line 2: Interest of 5 percent for the full principal in Year 1 and 5 percent interest for each year thereafter.
• Line 3: Annual parts and labor costs.
• Line 4: Estimated annual fuel costs.
• Line 5: Total costs of lines 1-4 divided by 15,000 miles for each year.
• Line 6: Resale value of the vehicle.
• Line 7: The resale value of each year divided into the maintenance cost.

Dolce-Illustration-1-Web

Note that the numbers in parentheses over Line 3 are the cumulative maintenance costs for each year. The first line of penciled-in numbers under Line 7 is the cumulative average of the maintenance cost divided by the resale value. The second penciled-in line is the average increase in maintenance cost divided by the resale value. This information turned out to be meaningless.

Time for Replacement
According to the industry best practice, it’s time to replace a vehicle or piece of equipment when the total maintenance cost of the unit being evaluated equals the total original purchase price. It’s also important to consider the unit’s reliability. For instance, in Year 8 the cumulative maintenance cost is $14,210, the maintenance cost is $6,200 and the vehicle’s residual value is $2,716. This vehicle is not reliable in its eighth year because it is often down for maintenance, plus it’s not available for use while it is being repaired. A low utilization rate costs your fleet an excessive amount of money.

It is desirable to give yourself enough time to be proactive in deciding when to replace a unit. You need time to propose its replacement and fund it with capital dollars to be accepted for your coming year, or fund it with operating dollars to rebuild it. If the unit is not needed, you need time to sell or scrap it.

Rebuilding is cost effective if you can spend half the cost of a new unit and get two-thirds to three-quarters the life of a new unit. For example, the $18,500 light vehicle’s cost-effective life cycle appears to be seven years, and it should be replaced at the end of its seventh year. If we were to consider a rebuild, half the cost of a new $21,000 vehicle would be $10,500, and its rebuilt expected life span would be five to six years.

In my experience, when a vehicle’s repair cost reaches 30 percent of its residual value, that gives you time to evaluate the vehicle to decide whether you want to replace, rebuild, repair, sell or scrap it. Costs for each alternative would be provided to management, and the capital and operating budgets should also be summarized. While a vehicle maintenance management information system would be very helpful with this, it’s not mandatory. You could set up a spreadsheet to start with and migrate to a management information system at a later date.

Vehicle Condition
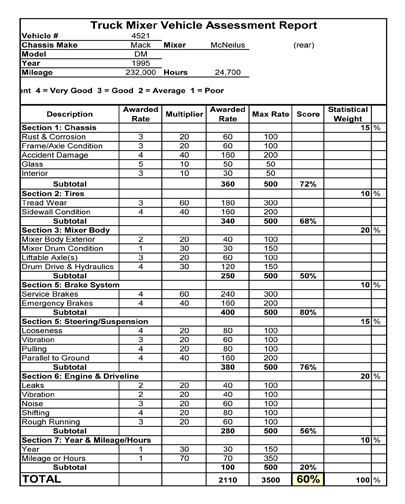
Now, let’s deal with the condition of the vehicle. In this type of situation, it’s best to use numbers as descriptors instead of words so meanings are interpreted the same way by each person who reviews them.

Using a digital camera, take pictures of the fleet vehicles, capturing all four sides – front, rear, left side and right side. Next, assign numbers 1 through 5 to rate the vehicle’s condition. Five would be an excellent rating, 4 would be a very good rating and so on. Then, after you’ve made number assignments, identify components to rate, including the chassis, body, brakes and engine. Rate component sections so that each, added together, totals 100. This will allow you to rate the unit with 100 as the top score. Numbers lower than 100 indicate deficiencies for each vehicle.

Dolce-Illustration-2-Web

After rating each unit, prioritize each one being considered for replacement, rebuild or continued repair. The worst units should be prioritized first. Determine the capital and operating funding that fits your strategic company plan, as well as the tactical funding needed to support service levels for efficient availability and productive and reliable utilizations. If you watch duty and life cycles annually, some units, whose maintenance costs are at a starting point of 30 percent of their residual value, may be able to have their life extended because of good maintenance and operating methods.

The ultimate goal is to come up with an acceptable average age for all classes of your vehicles so you can monitor the entire fleet. Watch and pay attention to everything and measure what’s meaningful to support timely, proactive, cost-effective corrective actions.

About the Author: John Dolce is a fleet facility and maintenance specialist employed by Wendel Companies, an architectural and engineering firm. He is an active consultant, instructor and fleet manager with more than 40 years of experience in the public and private sector. Dolce has written three fleet-related textbooks and teaches fleet management courses at the University of Wisconsin’s Milwaukee and Madison campuses.

Dolce-1-Web

Measuring Your Fleet Operation

In order for us to measure our fleet operation, we need to lay out numbers that illustrate our activity via activity-based costing. This gives us a picture of what is happening in terms of our fleet productivity and resultant profitability. The photo seen below is an excellent example of basic information that doesn’t make sense until it is explained, which is one way activity-based costing can assist your fleet. If we put our finger on the number 1 in the photo, we then look sequentially for 2, then 3 and so on.

Try this exercise: Give yourself 30 seconds and see how far you get sequentially during that time. After the 30 seconds is up, determine the number you achieved. Look at the sheet – how are the numbers laid out? Draw an imaginary line down the middle of the sheet. Note that odd numbers are on the left side; even numbers are on the right. Knowing this layout pattern, if we do the exercise a second time, we will focus on a 4-inch-by-10-inch layout rather than an 8-inch-by-10-inch layout. That should increase our productivity by 50 percent. Now, repeat the exercise and measure your productivity improvement.

Case Study Review
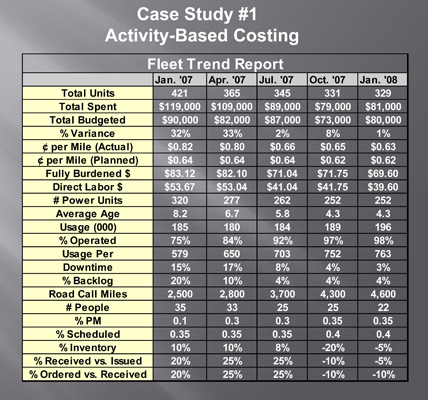
Next, review the case study below. Let’s go through the 22 line items to lay out the condition of this fleet. These categories will give us a picture of our fleet and its productivity. I’ll explain the meanings of each line item and, after that’s done, we can look at the overall condition illustrated by these categories and the numbered value for each line item.

Dolce-2-V2-Web

Column 2, Line 1 shows we have 421 vehicles. Line 2 states the total operating expenses are $119,000 for the month of January. In Line 3, you can see the operating dollars budgeted for the month are $90,000. Line 4 highlights an important point – that we are 32 percent over the operating budget for the month. Since we spent it, we have to get the extra spent money from somewhere. The money could come from another department’s savings or an advance from next month’s budgeted items, or it could be borrowed from a lender.

Line 5 indicates that our actual cost-per-mile average for our 421-unit fleet is 82 cents. In Line 6, you can see that our budgeted cost per mile for this month is 64 cents. Based on those figures, we are 18 cents per mile over our operating budgeted mileage cost. Line 7 shows that our fully burdened labor rate is $83.12 per hour. That includes direct labor plus benefits and all overhead such as heat, electric, supervision and clerical costs. This tells us that if an outside organization can do our maintenance and repair work for less than this number, they should be hired. Our shuttle time also needs to be included in the analysis.

Line 8 notes that direct labor is approximately $53 per hour, so if we pay our staff $15 dollars per hour for 2,080 hours per year (52 weeks x 40 hours per week), a third of that time is spent working on maintenance and repair tasks. Line 9 tells us 320 of the 421 vehicles are power units; the remaining 101 units are nonpower. In Line 10, you can see that the average age of the 421 units is 8.2 years. According to Line 11, 185,000 miles were accumulated for the month. We want that number to stay high because those are revenue miles that deliver our product and thus make money for the company.

Line 12 tells us that on average, 75 percent of the 421 vehicles are operating day to day, while 25 percent are not used. Line 13 indicates that each of the 421 vehicles averaged 579 miles this month (185,000 ÷ 421). However, if you divide 185,000 by 421, that equals 439, not 579. Don’t presume all your numbers are always correct; before you accept their accuracy, test the numbers and believe nothing until you have verified their integrity.

Line 14 shows that, of the 75 percent of the vehicles in operation, 15 percent are down. That means a net of 60 percent of the 421 vehicles are running; the other 40 percent are not running and probably are not needed. Line 15 tells us there is a 20 percent backlog of work waiting to be done, which indicates that the backup is excessive. There is a road call every 2,500 miles based on the information in Line 16. As we address our problems, we want this number to increase to validate our maintenance and repair efficiencies.

In Line 17, you can see that there are 35 staff members. Preventive maintenance (Line 18) is 10 percent of our workload, and scheduled work (Line 19) accounts for 35 percent. Line 20 tells us our parts and materials inventory is increasing 10 percent each month. According to Line 21, we’re taking in 20 percent more than we issue, which is one reason why our parts and materials are increasing 10 percent per month. Line 22 lets us know that we are ordering more than we need, supporting the fact that our parts and materials inventory is increasing 10 percent more than we need each month.

Corrective Actions
Now, what’s wrong here? We’re 32 percent over budget, but there are three activity-based numbers that tell us what to do to help correct our situation:
1. Forty percent of our vehicles are not needed. If we remove 100+ unneeded vehicles, the fixed costs of these vehicles will reduce our expenses.
2. Hopefully, most of these targeted reductions will be our power vehicles, which are more costly to own and operate than nonpower vehicles.
3. The third pertinent number is the average vehicle age. We want to remove older units since they are the most costly and least reliable.

Column 3 Review
Let’s review Column 3 to follow up on our corrective actions. We removed 56 vehicles from the 421 units, leaving 365 total units – a 13 percent reduction. Depending on your expertise and experience, some of you will remove 35 to 40 percent or whatever you’re comfortable with. That is fine, too.

Line 2 indicates expenses have dropped from $119,000 in January to $109,000 in April based on the reduction in vehicles, and in Line 3 you can see that the operating budget has been lowered an estimated $8,000. Line 4 shows that we’re still 33 percent over budget, but we’ll catch up next month – we have to reduce our budget for our reduced fleet. In Line 5, note that the actual cost per mile has gone down 2 cents, while Line 6 shows the planned cost per mile is steady.

The fully burdened labor rate has now dropped $1.02 per hour (Line 7) and direct labor is down 63 cents per hour (Line 8). In Line 9, note that power units are down by 43. Thirteen units are nonpower, which is good because power units are more expensive than nonpower units.

In Line 10, you can see the average age has dropped 1.5 years. That signifies the majority of the 56 units removed were older units. In Line 11, the revenue miles are holding relatively steady, so we’re not negatively impacting revenue. The percentage operated (Line 12) has increased 9 percent. More of our vehicles are being used, but we have more units to remove. Of 40 percent, 13 percent have been cleared out, so we have 27 percent to go. Usage per unit (Line 13) has risen from 579 miles (after testing the numbers, this should actually be 439 miles) to 650 miles. You will notice in Line 14 that downtime is still a problem; we need to take the time to prioritize and sequence our workload. However, backlog (Line 15) is down 10 percent, a positive event.

Road calls, per Line 16, now occur every 2,800 miles, a step in the right direction. Since a reduction in work requires fewer staff members, we are down two people since January (Line 17) who have hopefully been reassigned within the company. Line 18 shows that preventive maintenance is up from 10 percent to 30 percent of our workload. Scheduled work (Line 19) remains steady. Because Lines 20, 21 and 22 have not moved, we have to get the parts people up to speed. The fleet reductions are reducing the average age of the fleet, thus requiring fewer parts.

All in all, the numbers are falling in line with our corrective action. There are many problems that are responding to one corrective action – reducing the fleet by getting rid of older vehicles, thereby lowering the fleet’s average age.

Post-Audit Action Items
Generally, when an operational audit is completed, the following are common items that require corrective action. These items are listed in order of priority.
• Written policies and procedures are needed.
• Work standards and productivity measures are needed.
• Fleet size is too large.
• Management practices need improvement.
• Utilization and availability criteria are needed.
• Supervisors need training in participatory methodology.
• Communication upgrade on each level is needed.
• Quality must improve.
• Vehicle purchasing and procurement procedures need improvement.
• Transportation organizations need to look at centralization and decentralization strategies.
• Work scheduling needs to be quantified and upgraded based on frequencies, time, mileage and fuel use.
• Technical training is needed.
• Management by objectives needs to be implemented and upgraded.
• Look at in-house and outsource maintenance balance.
• Cost control systems need to be established and implemented.

About the Author: John Dolce is a fleet facility and maintenance specialist employed by Wendel Companies, an architectural and engineering firm. He is an active consultant, instructor and fleet manager with more than 40 years of experience in the public and private sector. Dolce has written three fleet-related textbooks and teaches fleet management courses at the University of Wisconsin’s Milwaukee and Madison campuses.

Modernizing Your Shop: Solution Implementation

In the last issue of Utility Fleet Professional, we looked at what factors affect productivity in your current shop, how to calculate space and technician needs, and the options available to you once you determine you want to upgrade your existing shop or build a new facility. Now it’s time to explore the design and implementation process. This article will cover everything you need to know, from the different project phases to site selection considerations to the solicitation of bids and beyond.

Project Inception
Considerations at the inception of the project for either an expansion or build alternative should encompass the following:
• The goal is to reduce costs, increase safety and improve productivity.
• The cost to rehabilitate the present facility is only $125 per square foot.
• The equipment cost is 30-35 percent of the facility cost.
• The ratio of vehicles per square foot of facility.
• Circulation with inside versus outside storage.
• A new facility costs roughly $200 per square foot, plus an equipment cost at 33 percent of the square footage estimate, which is approximately $65 per square foot or an estimated $265 per square foot total.
• Twelve feet of mortar equals 18 feet of steel equals 30 feet of outside height or 26-28 feet of inside height.
• Allow for electrical, water, steel, mortar and a 10-foot concrete apron around the facility.
• Follow Wicks Law regarding the on-site supervision of the general contractor. Wicks Law states that federal funding for local projects requires a general contractor to oversee all costs as the project progresses to prohibit unnecessary change orders that needlessly increase costs.

Project Sequence
Most renovation projects typically follow this type of sequence:
• Pre-design, which includes gathering input from the fleet manager, architect and designer.
• Schematic design (six months).
• Design development (12 months).
• Contract documents development (six months).
• Request for bids, receipt of quotes and award of contract (six months).
• Design build, which takes approximately 24 months and is a combination of the preceding three line items.
• Wicks Law for construction management of federally funded projects requires an extra level of project management to supervise the general contractor. This is done to ensure that government policies and procedures are followed.
• Site progress, which includes developing a schedule and retainage.
• Involve prime contractors and subcontractors, and hold coordination meetings.
• Wrap-up, warranty, facility use program and move-in.
• Testing followed by final payment.
• On-site, turnkey and warranty management.
• Liquidated damages for latent defects.

Shop Design Sequence
The pre-design stage is a line sketch of the desired layout including items such as general sizing, stockroom, shop administration offices, lighting, plumbing, electrical, water, air, supplies, work areas, lockers, support areas, washrooms, and welding and cleaning areas. The occupant and construction management firm architect will rough out footprint processes, topography and compatibilities. This process can take up to six months with timing, what-ifs, changes, and the learning curve of the customer and architect. The most knowledgeable party is the customer who fits into the facility; the architect suggests, but the customer is both accountable and responsible.

The following must be considered in the pre-design stage:
• Pre-design of the site including site selection, site short list and cost considerations.
• Input from fleet managers, administrative personnel, shop personnel and drivers.
• Clerical needs including equipment and work flow.
• Work methods and changes.
• Design layout: architect versus client versus consultant.
• Drawing drafts of the present building that include scale, access and inside versus outside.
• Revisions to the present building including limits, codes to follow, and required permits and fees.
• Meetings:
o Bid preparation, solicitation of bids, and evaluation of bids and bidders.
o Awards: schedule start and track progress.
• Construction site progress:
o Penalties for on-site progress.
o Coordination meetings.
o Changes.
• Completion, warranty, retainage and date of return for evaluation.

Site Selection
Site selection involves consideration of the following:
• Cost to prepare the site.
• Demolition of the site; full and/or partial liability for contaminated sites.
• Site inspection; estimated renovation or rehabilitation required.
• Environmental issues, drainage considerations and wildlife protection.
• Mileage variations to the new facility and cost adjustment.
• Facility growth for five years, 10 years and beyond.
• Alternative fuel use to offset capital outlay.
• Utility access for water, electric and gas.
• Traffic flow.

Layout Alternatives
The following are layout alternatives:
• Stock room access.
• Floor drains: slope.
• Lights: natural and artificial.
• 110-, 220- and 440-volt outlets.
• Ventilation and skylights.
• Concrete finish.
• Water and air lines: freezing.
• Epoxy: hardening.
• Storage: light and heavy.
• Seal and color of concrete.
• Fans for heat and ventilation.
• Compressed air.
• Heavy-duty: workbench, light and air.
• Roof-mounted equipment.
• Drawers: rollout and slide-out.
• Roof integrity: ladders.
• Floor access versus overhead access.
• Floor bolting and painting.
• Oil, air, water and electrical disposal.
• Welding, gas and electric.
• Three-quarter- to half-inch: psi range.
• Posts and doors.
• Antifreeze: new and recycled.
• Brakes and drums.
• Silicon: permanent extended life.
• Cranes: overhead versus jib.
• Recovered oil: antifreeze.
• Waste storage.
• Hazardous versus residual versus commercial wastes.
• Primary, secondary and tertiary storage of hazardous material wastes.
• Line painting: safety.
• Vehicle exhaust system.
• Corner guards.
• Exhaust temperature.
• Convex mirrors.
• Electric fuse box index.
• Mark piping: color code fluid lines.
• Downspout: cast versus aluminum.
• Fifty candlepower at floor level.
• Continuous floor drain: inside diameter.
• Concrete aprons.
• Shop drains: oil water separator.
• Battery room.

Schematic Design
The next step is a schematic design phase during which a layout is drawn to scale, incorporating the customer’s wants and needs and fitting in equipment, HVAC, electrical and plumbing, plus general construction specifications and upgrade of pre-design ideas into acceptable reality. The architect brings experience to the following areas:
• Considerations of present work flow space.
• Whether to leave or transfer present equipment.
• Drafting a new, site-specific layout and defining dimensions.
• Identifying equipment.
• Stating the location of equipment.
• Proposing the fit of equipment in the location.
• Drafting dimensions for electric and fluid needs.
• Brainstorming meetings.

Schematic design issues include the following:
• The new facility is site specific.
• This will alter the present footprint and practices.
• Receptiveness of the occupant to the new layout.
• The cost of change from present practices to new practices.
• The cost per square foot of the new facility for budget purposes.
• Project start date.
• Present date.
• Budget changes.
• Build date.

Design Development
The next stage is design development, which is a solicitations document phase. The architectural drawings are priced from the schematic design phase, and the funding needed is dedicated to this project. If the funding is inadequate, the schematic design phase must be altered to fit the funding, which must include inflation because it will take two to four years to solicit, award, and initiate the project and accommodate the changes.

Retainage – when the general contractor, prime subcontractors and subcontractors are paid, minus a percentage that will be held for warranty resolution – must be defined at this point. What are the amounts, terms and conditions? Target retainage is 15 percent, negotiable to 5 percent. Payment times are six months from the date of occupancy, and any changes have a six-month warranty extension tied to the finish date of that change.

The following elements are included in the design development:
• Drawing submissions and review; traffic and work flow; as-built and final drawings.
• Unique issues:
o Work methods.
o Utilities.
o Communication and time clocks.
o Data processing.
o Security.
• Administration, shop, offices and parking:
o Access for pedestrians and vehicle flow.
o Numbering, odd and even parking spaces.
• Tools and equipment, electric, water and effluent.
• Shop needs:
o Rebuild, repair or preventive maintenance.
o Painting.
o Bodywork.
o Washing.
o Cleaning.

Strategies and Expectations
Strategies
• Follow Wicks Law with a construction management plan.
• Provide construction management of the general contractor, prime contractors and subcontractors.
• Consider design build versus design and build by one or many architects and engineering firms.
• Company management of the architect and builder.
• Bid preparation, solicitation, evaluation and award.
• Start date, work schedule and coordination meetings.
• Meetings for site selection, design, schedule and site remediation as to its footprint.
• Payment and change orders, threshold limits and penalties.
• Warranty and retainage, training and manuals.

Management Expectations
• Construction progress updates, pictures and videos.
• Script: outline, lesson plan and library of videos.
• Facility maintenance schedule and tasks.
• Application-specific manuals for parts and service.
• Warranty and latent defects and liquidated damages.
• Extended warranty, replacement warranties and double extensions.

Equipment Program
A good equipment program involves consideration of the following:
• Specifications and cut sheet.
• Power: location and work flow.
• Delivery, setup and training.
• Acceptance and payment.
• Warranty and 5 percent estimated retainage.
• Liquidated damages for latent defects.
• Videos:
o One thousand dollars per minute, finished product and multiple choices.
o Tripod, script, outline and lesson plan.
o Equipment vendor instructor.
• Move-in:
o Parts, supplies and materials first (weekend one).
o Skeleton staff (weekday).
o Maintenance and repair staff and their tools (weekend two).
o Transition from one weekend to another weekend.
• A person on-site to manage the warranty-poor materials, poor workmanship and design defects.

A critical issue is that the customer who occupies the finished facility expects a turnkey environment. An experienced architectural and engineering firm will provide a professionally qualified employee to be on-site to manage the 5 percent retainage. This person will sit with the customer, teach him or her how the facility is designed to work, and walk him or her through that process. This costs one person’s salary for six to 18 months depending on the complexity and sophistication of the facility and the equipment installed.

Design development is the time during which specifications are developed for the facility and its equipment for solicitation. These specifications must be a combination of functional and technical details and should include training needs, service, parts and supply books, CDs organized in a standard format with a defined warranty for latent defects (i.e., design defects not readily recognizable), and installation expectations with liquidated damage (late installs) documentation for penalties.

Solicitation of Bids and Award
The solicitation phase details all phases so that subcontractors, prime contractors, general contractors and construction management firms can delineate their costs while being aware of specific time and quality issues.

The design documents convey expectations in every detail so that bid prices can be compared, with the best bid being the lowest bid that addresses all issues. Should the award be split, portions can be divided accurately and a valid comparative analysis can be made.

The next phase is to solicit the contract documents for a request for proposal, where the terms and conditions are reviewed with bidders and suggestions are taken and evaluated to make the documents more accessible to more bidders. This increases competition, which leads to more competitive pricing and better responses. With the bid proposal reviewed and updated as deemed appropriate, now a request for quote can be issued. It is important to solicit as many local job site firms as possible, noting start dates of each phase and technological assignments so that one phase is completed and another can begin. Should a phase be extended unnecessarily, it will force other start times to change. In turn, this will cause schedule delays, delay the project completion date and result in a delay for the new occupant to move into the new facility.

Once the bids are received, compared, analyzed and awarded, bonds are posted along with an agreed-upon completion date.

The principals of the project are named, and the construction site is set up with temporary quarters, phones, faxes, telecommunications, personal computers, networks, offices, files, security and information published to enable all principals to communicate.

Construction Begins
Weekly meetings on the job site are scheduled; the meeting format is agreed upon; a numbered day ledger is opened; daily notes are entered; the schedule is posted; meetings are taped and noted; and the meeting minutes are circulated with timetables established, variances noted, and windows targeted and measured.

On-site progress is monitored by weekly photos from four standard locations. Videotapes are made weekly and dated for historical reference. If it is a public project, appropriate notifications are provided to funding agencies of regular meeting schedules with progress reports and change orders. Contractor changes due to nonperformance are discussed, adjusted, and resolved to keep the project on schedule and to hold costs to estimates.

Most governmental projects have regulatory requirements to communicate project progress to the different agencies that fund prorated projects (e.g., 75 percent federal, 10 percent state and 15 percent city). Each entity would contribute, at predetermined times, percentages of the total funding of the monies to pay the contracted firms. A time and completion plan is defined to direct this process.

For example, Wicks Law states that a construction management firm must monitor the progress of the general contractor, prime contractors and subcontractors; facilitate changes to keep the integrity of the program on time and uphold the quality of work; and be responsible to the funding agencies to inform them of progress and corrective actions taken to keep the project on time and at the estimated cost. This must be done on a regular basis at a minimum of monthly or targeted quarterly intervals so that payments are received on expected due dates.

During the on-site construction phase, inspectors monitor the progress in the on-site job ledger and discuss issues weekly with the prime contractors and subcontractors.

When the project is completed, a walk-through is scheduled with the general contractor, prime contractors and subcontractors. The walk-through is videotaped and a punch list is developed. Also, a written summary is drafted for tracking fixes with reference to compliance for penalty and payment validation.

Move-In Program
Around the time when closure is evident from the punch list, a move-in program is started with the client. The move-in process is defined, sequenced and prioritized, with shelving, furniture, phones, and equipment in place and tested. A temporary certificate of occupancy is obtained. A person from the construction management firm is assigned to coordinate the move, supervise the start-up, and work out the glitches and bugs with the management of the retainage so that the transition is smooth and a comfort level is established and maintained.

The occupant needs support in the day-to-day operations of the facility, in familiarity with the as-built drawings, and in problem-solving or troubleshooting of equipment problems. The on-site representative of the construction management firm is familiar with the general contractor, prime contractors and subcontractors. He or she can facilitate any problem-solving and troubleshooting with the principals, or the retainage can be used to hire other firms to correct the problems.

The on-site person’s salary and expenses could be funded from retainage. When funding runs out in 18 months, that person would leave because the momentum of the new facility would be up to speed and would meet the design and functional expectations.

Each piece of equipment should have a manual that is standardized in a common format that complements a video of the equipment operations and training, with three sets of each. One set should be kept on-site for day-to-day use, one set should be maintained in the corporate library to copy in case the on-site copy is in use or missing, and one set should be stored off-site for reference and as a copy resource.

Client Involvement
In order for the project to be successful, close interaction is required by the design team from the construction management firm, the design firm and the occupants of the new facility.

The new facility, aside from site specifics and the design complement of topography footprint, should be built around the client-occupant if the client will manage his facility for five to 10 years upon its completion. Designs and work flows are flexible and should fit the client’s needs or perceived needs.

Depending on his or her experience, the architect has a perspective that is limited because he or she does not have experience working in this or any other similar facility. Given a set of circumstances and limitations, the architect can provide alternatives based on his or her experience.

The client will use the facility day after day, so he or she will need to move seamlessly into the new facility and show increased productivity because of the features and benefits the new facility will offer.

Conclusions
Day to day there are three perspectives we need to acknowledge:
• The way one person sees it (the architect/engineer).
• The way another sees it (the occupant).
• The way it really is (general contractor and/or construction management firm).

It is the general contractor and construction management firm’s responsibility to see that the architect, engineer and occupant see what it is in the same way.

This is a once-in-a-lifetime event. You need experience and savvy to do it. If you’ve never done this before, the architect and engineer bring experience and savvy for your consideration. They understand and are attuned to help you get the facility you need to increase productivity and improve your safety experience.

About the Author: John Dolce is a fleet facility and maintenance specialist employed by Wendel Companies, an architectural and engineering firm. He is an active consultant, instructor and fleet manager with more than 40 years of experience in the public and private sector. Dolce has written three fleet-related textbooks and teaches fleet management courses at the University of Wisconsin’s Milwaukee and Madison campuses.

Modernizing Your Shop: Productivity, Space and Technician Considerations

In order to keep up with the evolution of your fleet, it may be time to analyze the layout of your current shop to determine if you need to upgrade the facility or design and build a new facility.

To give you an idea of what happens when an organization doesn’t keep up with the evolution of its fleet, let’s review an example of a facility that operated when horses pulled wagons. The horses lived in barns. When the horseless carriage was introduced and there was no longer a need for the horses, they were sold and the barns were used to store, maintain and repair the horseless carriages. As the horseless carriage became more advanced, more were added to the fleet and the barn was modified to meet the needs of the carriages. The increase in the size of the vehicles forced the carriages to be stored outside so that maintenance, service and repair could take place inside the barn.

Lights and equipment such as jacks, lifts, drill presses, welding tools, gantry cranes, parts and supply areas, tire service areas, pits, wash areas and battery rooms were added. This addition process eventually converted the barn into a garage without physically replacing the barn. While it wasn’t an ideal situation, everyone made do. In this case, the symptom was treated, but the root cause was not addressed.

As the fleet increased in size, more staff members were hired. The space, however, stayed about the same. Two people worked on one vehicle in one bay, which was big enough to hold half the vehicle, but the other half extended outside. An unanticipated factor – weather – thus affected productivity. If it rained, the workers got wet and took significantly more time to perform the task at hand. If the weather turned cold, the door was propped open, the heater kept running and the heat escaped the building.

Built for Productivity
In contrast, let’s look at an example of a medical surgery facility that was designed and built for its specific purpose – efficiency and medical excellence. There is one operating room and multiple patients who are waiting to get procedures.

In this scenario, if a patient needs hip surgery, the surgeon speaks with the patient, diagnoses the problem at the office, determines the time it will take to complete the procedure and secures an operating room for a fixed period of time. Using a 10-hour time frame as an example, the surgeon, knowing a hip replacement takes approximately two hours, will schedule five patients for that period of time. Some patients will take 1.5 hours and some will take 2.5 hours.

After 10 hours and five procedures, with backup staff in the operating room to cover breaks and emergencies, this becomes a very efficient process. The operating room has all the tools, space and supplies for all staff members to be productive because it was designed this way before it was built.

In the case of the barn, servicing vehicles is less efficient in that space because – while there is the potential for numerous vehicles to be in the facility at the same time – it was originally built to house horses, not vehicles.

What Impacts Productivity?
With proper space allocation, a garage can offer both the potential of a reduced carbon footprint and the opportunity for increased productivity. Creating the garage is a once-in-a-lifetime event that demands experienced planning. Because almost every act is sequenced for efficiency and productivity, a fleet business requires order and discipline. Tools, supplies, equipment, fluids, monitors and support services must be laid out to efficiently maintain the fleet.

Due to funding limitations and other priorities, organizations often make do with existing facilities, outdated equipment and inefficient worker footprints, which can negatively affect productivity and result in energy loss. Space limitations and unscheduled work, in particular, can impact productivity.

Scheduled work, on the other hand, is easier to manage. When a vehicle is brought into a shop for a preventive maintenance inspection, the technician knows how much time the process will take – it has been performed many times and is sequenced with the technician’s activity. Mechanics are trained in this process, and since all the necessary resources are available, all inspections can be assigned to a bay for scheduled work in a predictable time frame.

When you consider the job requirements of a staff of technicians, there are more than 500 types of tasks they may be responsible for. Some of these tasks are done repetitively, including work on brakes, radiators and water pumps, wheel removal and replacement, and air/oil filter changes. These tasks, however, make up only 30 percent of total maintenance work, meaning just 30 percent of work hours can predictably be assigned to work bays. That means 70 percent of the remaining work is unpredictable and requires more space per job.

What is the impact of unscheduled work? Let’s say a technician brings a vehicle into the shop that has been identified by a driver as having noise in the engine and a lack of power. If the technician diagnoses the number five cylinder as the problem, removes the piston and finds the wrist pin is also defective, a delay occurs. Since the shop does not stock wrist pins or fit pistons, the work on this part will have to be sent out. This causes the bay to be tied up until the parts come in and the technician installs them. What do the technicians assigned to this bay do while waiting for the part? They should be put to work in another bay. Theoretically, each unscheduled technician needs one-and-a-half bays assigned to him or her to be productive. Doubling up people in a bay can lead to delays and is unproductive.

Calculating Space and Technician Needs
How, then, are space needs calculated? Since space is a capital issue, having too little space can be just as bad as having too much space. This expense has to be prioritized and a three- to five-year return on investment – or more – has to be justified.

Let’s assume that a fleet workload was 20,000 hours in the last 12 months. As the fleet gets older or grows, the work increases 10 percent per year with a limited replacement program. Of the 20,000 hours, 2,000 were completed outside the shop while responding to road calls, breakdowns and tire changes, leaving 18,000 hours for shop work. Based on that information, how much space is needed? If the shop is open eight hours per day, five days per week, 52 weeks per year on one shift, that is 2,080 hours per year, per bay available on one shift. The 18,000 hours divided by 2,080 hours in bay availability equals 8.65 bays on one shift, which means that nine bays are needed at a bare minimum for vehicle service. For 20,000 hours with one shift, 9.62 or 10 bays are needed at a minimum. If you have multiple shifts, this requirement could be broken down to five bays on two shifts or four bays on three shifts.

How many technicians are needed? If one technician works five days a week, eight hours per day for 52 weeks, that would equal 2,080 payroll hours. In addition, technicians are also paid for 280 hours when they are not at work, as follows:
• Three weeks for vacation (120 hours).
• Two weeks for holidays (80 hours).
• One week for training (40 hours).
• One week for illness (40 hours).

This brings the total working hours down to 1,800. If you factor in time for washing up and coffee breaks, this adds up to 225 hours. If another 275 hours are added for diagnostic, cleaning, parts retrieval and toolbox time, working hours now total a net of 1,300 hours per available technician.

If you divide the 20,000 hours (the 12-month workload) by 1,300 (the hours per technician), this equals 15.38 technicians. Let’s presume the .38 is used in overtime or vendor work and that 15 technicians are needed for the 12-month period. If you factor in 10 percent inflation for the aging of the vehicles, that equals 22,000 hours. Divide that by 1,300 for a total of 16.92, or 17 technicians that will be needed for the next year.

If the average of scheduled work is 30 percent and the unscheduled work average is 70 percent, the number of bays needed is calculated below:
• 17 technicians x 30% = 5 technicians who need 1 bay each for a total of 5 bays.
• 17 technicians x 70% = 12 technicians who need 1.5 bays each for a total of 18 bays.

This shows that 23 bays are needed for one shift, 12 bays are needed for a two-shift operation and eight bays are needed for a three-shift operation.

If this is a nine-bay shop and there is only one shift working, 14 bays need to be added. If it is a two-shift schedule, three more bays need to be added, the work needs to be sent to vendors or the staff needs to be reduced to fit the nine bays. Three shifts would work. In most cases, until space is expanded, productivity is being choked.

Keep in mind that there are reasonable solutions to these problems, but they first need to be identified. A logical process must be followed when determining whether to expand or reduce the size of the present shop, relocate to another facility or build a new shop.

Consider Your Options
What are the costs of upgrading an existing building compared to building a new facility? Which is more cost-effective?

Consider the impact of a no-build or existing building upgrade option at $125 per square foot. In addition to the square-foot cost, facility and shop equipment costs will add an estimated 30 percent to the total no-build estimated cost. These total costs for upgrading should be compared to the total costs to build a new replacement facility.

Next, consider designing and building a new garage with the proper number of work bays – which are typically 20 feet wide and 50 feet long – and a parts support area that is 20 percent of the total work space for a light-duty fleet, with 33 percent of the total work space allotted for a heavy-duty fleet, including offices, locker rooms, showers, toilets, a lunch area and other support services. The square-foot cost of a new facility is estimated to be $200 per square foot plus the cost of equipment such as lifts, lathes, benches, cranes, storage shelves and optional equipment. These costs will add an estimated 30 percent to the total new-build estimated cost. Note that some items can be disassembled from the old building and reassembled in the new facility depending on their age, condition and project life cycle.

A service provider may want to consider the option of building a shared facility that is equally accessible to other fleet maintenance providers. This option can significantly reduce funding requirements.

Environmental upgrades add cost to the new building option, and you will also need to consider the layout of the new site in terms of parking, traffic flow, and bay and support area configurations.

In addition, organizations need to determine if they can work in the present facility while upgrading or if they will need to relocate to a temporary facility. This is determined by the present operation and the type of equipment being used. Shuttle time from domicile to route assignments should be considered as well.

With the construction cost calculated and its features and benefits evaluated, a comparison of the new alternative can be made to the no-build alternative, and a choice can be made: rebuild the present facility, replace it with a new facility, partially rebuild the present facility or do nothing. With the do-nothing approach, the present facility is used as is, work not handled cost-effectively can be outsourced, and/or part of the workload can be relocated to another smaller facility closer to the domiciled vehicle location.

Unless you choose the do-nothing approach, the next step is implementing the chosen solution. Be sure to pick up the next issue of Utility Fleet Professional for an in-depth look at the implementation process.

About the Author: John Dolce is a fleet facility and maintenance specialist employed by Wendel Companies, an architectural and engineering firm. He is an active consultant, instructor and fleet manager with more than 40 years of experience in the public and private sector. Dolce has written three fleet-related textbooks and teaches fleet management courses at the University of Wisconsin’s Milwaukee and Madison campuses.

Utility Fleet Professional

360 Memorial Drive, Suite 10, Crystal Lake, IL 60014 | 815.459.1796

KNOWLEDGE, INSIGHT & STRATEGY FOR UTILITY FLEET LEADERS

Utility Fleet Professional is produced by Utility Business Media, Inc.   View Capabilities Statement

Get the Utility Fleet Professional Digital Edition App

Get the iP Digital Edition App


© All rights reserved.
Back to Top