Replace, Rebuild or Repair?
How do you complete an economic analysis to cost-effectively determine whether to replace, rebuild, repair, sell or scrap vehicles and equipment? How do you ensure that your choice is the right one made at the right time, and that it supports your fleet’s tactical and strategic operating plans?
To start, you must assure yourself that your fleet’s vehicles and equipment being considered for replacement are fully utilized. If they’re not, instead of replacing them, think about reducing them from the fleet inventory and renting the units as needed. You can measure your fleet operation by laying out figures of activity-based costing to evaluate the facts, which will give you a picture of your fleet’s productivity and profitability.
Let’s look at an example of activity-based costing. The chart below shows the eight-year cumulative costs of an $18,500 light vehicle. The seven lines of the chart reflect the following:
• Line 1: Principal of $18,500 spread (depreciated) over five years.
• Line 2: Interest of 5 percent for the full principal in Year 1 and 5 percent interest for each year thereafter.
• Line 3: Annual parts and labor costs.
• Line 4: Estimated annual fuel costs.
• Line 5: Total costs of lines 1-4 divided by 15,000 miles for each year.
• Line 6: Resale value of the vehicle.
• Line 7: The resale value of each year divided into the maintenance cost.
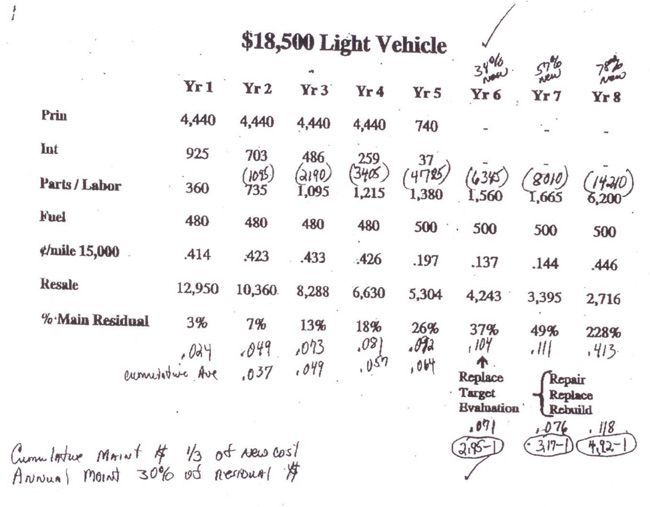
Note that the numbers in parentheses over Line 3 are the cumulative maintenance costs for each year. The first line of penciled-in numbers under Line 7 is the cumulative average of the maintenance cost divided by the resale value. The second penciled-in line is the average increase in maintenance cost divided by the resale value. This information turned out to be meaningless.
Time for Replacement
According to the industry best practice, it’s time to replace a vehicle or piece of equipment when the total maintenance cost of the unit being evaluated equals the total original purchase price. It’s also important to consider the unit’s reliability. For instance, in Year 8 the cumulative maintenance cost is $14,210, the maintenance cost is $6,200 and the vehicle’s residual value is $2,716. This vehicle is not reliable in its eighth year because it is often down for maintenance, plus it’s not available for use while it is being repaired. A low utilization rate costs your fleet an excessive amount of money.
It is desirable to give yourself enough time to be proactive in deciding when to replace a unit. You need time to propose its replacement and fund it with capital dollars to be accepted for your coming year, or fund it with operating dollars to rebuild it. If the unit is not needed, you need time to sell or scrap it.
Rebuilding is cost effective if you can spend half the cost of a new unit and get two-thirds to three-quarters the life of a new unit. For example, the $18,500 light vehicle’s cost-effective life cycle appears to be seven years, and it should be replaced at the end of its seventh year. If we were to consider a rebuild, half the cost of a new $21,000 vehicle would be $10,500, and its rebuilt expected life span would be five to six years.
In my experience, when a vehicle’s repair cost reaches 30 percent of its residual value, that gives you time to evaluate the vehicle to decide whether you want to replace, rebuild, repair, sell or scrap it. Costs for each alternative would be provided to management, and the capital and operating budgets should also be summarized. While a vehicle maintenance management information system would be very helpful with this, it’s not mandatory. You could set up a spreadsheet to start with and migrate to a management information system at a later date.
Vehicle Condition
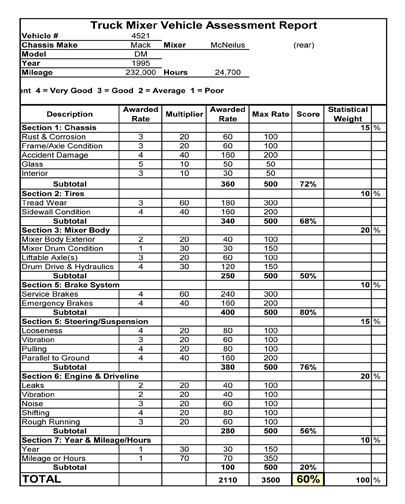
Now, let’s deal with the condition of the vehicle. In this type of situation, it’s best to use numbers as descriptors instead of words so meanings are interpreted the same way by each person who reviews them.
Using a digital camera, take pictures of the fleet vehicles, capturing all four sides – front, rear, left side and right side. Next, assign numbers 1 through 5 to rate the vehicle’s condition. Five would be an excellent rating, 4 would be a very good rating and so on. Then, after you’ve made number assignments, identify components to rate, including the chassis, body, brakes and engine. Rate component sections so that each, added together, totals 100. This will allow you to rate the unit with 100 as the top score. Numbers lower than 100 indicate deficiencies for each vehicle.
After rating each unit, prioritize each one being considered for replacement, rebuild or continued repair. The worst units should be prioritized first. Determine the capital and operating funding that fits your strategic company plan, as well as the tactical funding needed to support service levels for efficient availability and productive and reliable utilizations. If you watch duty and life cycles annually, some units, whose maintenance costs are at a starting point of 30 percent of their residual value, may be able to have their life extended because of good maintenance and operating methods.
The ultimate goal is to come up with an acceptable average age for all classes of your vehicles so you can monitor the entire fleet. Watch and pay attention to everything and measure what’s meaningful to support timely, proactive, cost-effective corrective actions.
About the Author: John Dolce is a fleet facility and maintenance specialist employed by Wendel Companies, an architectural and engineering firm. He is an active consultant, instructor and fleet manager with more than 40 years of experience in the public and private sector. Dolce has written three fleet-related textbooks and teaches fleet management courses at the University of Wisconsin’s Milwaukee and Madison campuses.
