Tag: Management

How to Measure Performance

Informed, effective decisions are rooted in accurate data. That was precisely the goal behind a survey on Key Process Indicators (KPIs) conducted by the Electric Utility Fleet Managers Conference. At its 2013 gathering, EUFMC presented results of that survey, which was completed by more than 100 utility companies. The findings provide a helpful list of valuable KPIs:

Availability: Vehicle Downtime, Mean Time between Repair, Ratio of Time in Shop to Time in Service, and Total Hours Available are used to prioritize engineering focus, make decisions about overtime and staffing levels, and address service level commitments by identifying hiring needs as well as areas for outsourcing specific repairs and services.

Budget Compliance: YTD Budget and Spend Comparison, Capital Budget Compliance, and Actual vs. Budget Financial Reports are used to adjust business plans, spend rates and purchase plans, and for controlling expenses for overtime, outside services and staffing. This metric is viewed as a primary driver for overall fleet direction.

Cost Per Customer: Fleet Cost Per Retail Customer, Total Cost Per Internal Customer, and Fleet Cost Per Customer – External all help target improvement goals and more efficient purchasing for specific departments, as well as help reduce overall fleet size based on underutilization findings. Management decisions based on this KPI have led to new vehicle standards, increased utilization by right-sizing fleets and streamlined processes.

Fuel Consumption: Average MPG, Fuel Consumed Per 100 Mile/KM, and Fuel Usage Comparison measures are used for defining areas of focus for driver performance improvement, forecasting fuel costs and validating fuel purchasing programs, and making vehicle acquisition and technology decisions, including selection of more fuel-efficient vehicles.

Mechanic Time: Indirect vs. Direct Labor Comparisons, Monthly Vehicles Worked On and Work Orders Completed, Technician Billable Hours, and Overtime Report tracking help prioritize work and identify slower times that can be used for employee training, determine staffing levels and fleet size by location, and perform cost analyses for specific activities.

PM Metrics: PM Completion Rate, Percent of Units Meeting PM Scheduled Deadlines, and PM Average Completion Rate help ensure preventive maintenance program compliance, align the workforce to support locations, develop plans to address overtime and outsourcing, and evaluate PM workload goals.

Safety: Miles Driven without a Controllable Vehicle Accident, Number of OSHA Incidents by Department, and Near Miss Reports are helping with purchasing decisions on type/brand of equipment, addressing workforce shortages, overtime and outsourcing activities, and with the focus on compliance.

Cost Per Mile: Average Total Cost Per Mile and Total Cost Per Mile by Unit Type are eliminating excess idle time and lowering acquisition costs. Operating Cost Per Mile/KM and Operating Cost Per Vehicle enable more effective cost management decisions.

Total Cost Per Unit: Monthly Expense Reports by Unit, Cost Per Unit, and Total Expense by Type of Unit (with a Ten Year Comparison) are helping evaluate operating costs for labor, materials, supplies/tools, outside services and internal shops, and introduce programs to reduce maintenance costs.

Utilization: Fleet Utilization, Projected Miles and Monthly Mileage by Department reports are optimizing fleet size.

Work Order Metrics: PM Mechanic Time vs. Repair Time, Preventive Maintenance, Corrective Work Percentage, and Repair and PM Turnaround Time tracking help focus on education and training, and making shift personnel and workload evaluations.

Across the board, these fleets reported that business decisions made as a result of focusing on measures that gauge the effectiveness of management strategies are an important part of raising performance standards. For more information about EUFMC, visit www.eufmc.com.

Seth Skydel
Editor

Bassarab-Maxey-4-Web

Towing Vehicles Over Snow and Ice

Now that fall has turned into winter and snow threatens to ice over roads and deliver countless traffic jams and detours, what would normally be a four-hour job at a remote site will likely be transformed into a backcountry expedition. As we gear up our fleet for the wintertime, we need to remind ourselves and our drivers about the driving and trailering hazards that snow- and ice-covered roads create. Breakdowns and accidents may not be entirely avoidable, but some potentially disastrous situations can be prevented even before leaving the shop.

Pre-Trip Inspections
Pre-trip inspections are a must for all work-related driving and trailering. In addition to inspecting all of the critical components of a tow vehicle and trailer before embarking, following are a few more common points that are often overlooked:

Tire Inflation
Most everyone will reiterate how important proper tire inflation is, but when was the last time anyone put a gauge on those tires? Every 10-degree drop in temperature will reduce your tire pressure by approximately 1-2 psi. Check tire pressure often because even a small psi drop can significantly compromise tire traction and dependability, especially over snow and ice.

Hitch Capacity
Ensure the capacity of the trailer hitch is properly rated for the trailer you are about to tow. Don’t assume that because it’s on the trailer, it’s the right capacity. You also might want to consider installing a weight distribution hitch. These hitches greatly improve towing capacity, brake performance and general stability in winter driving conditions.

Survival Gear
A vehicle breakdown in a remote area can quickly escalate from an uncomfortable situation to a potentially dangerous one if no heat is available. A fully stocked survival kit should be stored in any vehicle traveling off road or to remote locations. If you don’t have a survival kit, here are a few critical supplies that all vehicles should have:
• Ignition sources: Always have multiple sources of ignition – such as lighters, strikers or matches – in the event that you need to build a fire nearby to warm up.
• Emergency space blankets: Taping up space blankets in the cab of a broken down truck can raise the inside temperature from below freezing to 70 degrees in minutes.

These are critical supplies that are too inexpensive to overlook. A few space blankets and boxes of matches can cost less than $10 and save your life if you become stranded in the wintertime.

Trailer Loading
Ensuring the center of gravity (CG) is properly placed on the trailer is crucial for trailer towing. A load that is out of CG from front to back will lead to dangerous vertical loading and unloading at the hitch point and possibly to a loss of front axle brake performance. Placing the load CG too far to the rear also can lead to dynamic instability of the trailer and cause it to fishtail side to side. It is extremely important to avoid this when the traction coefficient of the tires is compromised due to snow and ice on the road.

Another important point to keep in mind is that safety regulations require that all cargo control equipment used is to be inspected prior to each and every use. Do your straps have any cuts or tears in the area that will be used for securing the load? Are the straps protected against sharp edges? Are securement chains free of any damaged links? Even after securing the load and driving a few miles, especially when off road, it may be necessary to stop and check the tension on the securement chains or straps since it is possible that they have loosened.

Stopping Options
Do each of your vehicles and trailers have antilock braking systems (ABS)? Even with an ABS, a driver still has to understand how to provide driving inputs that allow the ABS to work most effectively. Since the ABS only assists in decelerating, the speed at which you are traveling, as well as the steering inputs that you provide, may hinder how quickly the ABS can help bring you to a stop.

Stopping in a Turn
When attempting to stop in a turn, should you straighten the wheel and apply the brakes even though you might be steering off the road? You have more traction and would stop faster by straightening the wheels, but is there a ditch or is the road on flat ground where it may be safe to drive off straight? It would be much safer to go straight into the ditch and much easier to tow the vehicle out of the ditch after going in straight as opposed to going in sideways.

Another option is to continue in the turn and apply the brake at the same time to try to stay on the road. Doing this may keep you on the road, but you also have the least amount of traction and face the consequence of sliding sideways and possibly off the road.

The key factor here is understanding when you have committed to going off the road. Many untrained drivers don’t think they are going off the road until their tires have crossed over the white line, which can be a deadly mistake. A trained driver will understand that if they make a mistake, such as approaching the turn too fast, they actually committed to going off the road well before they hit the ditch. Understanding this point a split second earlier can allow you to make a better decision of the two bad choices that you now have. Putting it another way, you could ask yourself, “Do I want to end up in the ditch?” or “Do I want to end up in the ditch sideways and possibly roll over?”

Descending Steep Grades
Steep grades can pose some of the most dangerous driving conditions in winter. Stopping distances can be exponentially larger when traction is reduced by snow and ice and momentum is increased due to the weight of a trailer. Starting a decline too fast can put you in the same situation as approaching a turn too fast – you may have committed to going off the road well before you realize it.

There are no absolute safe driving procedures to follow when driving on snow and ice. Every road, every patch of ice, every vehicle and every tire is different. It is important to train drivers about how to utilize the vehicle-trailer combination to properly perform in the conditions in which they are expected to drive. While you may think that you have acceptable traction at one point, conditions can quickly change and that traction may not be there when it is needed. The most important thing you can do is understand the conditions that surround you and drive in a manner that allows you to safely react if something does start to go wrong.

About the Authors: Nick Bassarab is Safety One Training International’s operations manager and a lead trainer for the company’s ice driving and trailering classes. Safety One, based in Littleton, Colo., also offers training classes on snowcat operations and winter survival, tower climbing and rescue, and other critical safety subjects. Learn more at www.safetyoneinc.com.

Carl Maxey is the president and general manager of Maxey Manufacturing and Trailer Sales in Fort Collins, Colo. He also is a former president of the National Association of Trailer Manufacturers and a lead trainer for Safety One’s ice driving and trailering classes.

Shop Safety and Efficiency

Safety is a high priority of professional fleet managers. Fleets are known to spec their operating equipment to be the safest possible for the work they will be doing, and they train their operators to always work with safety in mind. In addition to safety, efficiency also is an important aspect of operations in well-run maintenance shops.

“Since labor accounts for about 60 percent of a fleet’s vehicle service and repair budget, it makes sense that anything a fleet can do to maximize technician efficiency will result in a bottom-line savings,” said Doug Spiller, heavy-duty product manager for Rotary Lift (www.rotarylift.com). “The biggest factors affecting technician productivity are access to vehicle components and room to work efficiently. Vehicle lifts provide more convenient, comfortable access to every serviceable part on a truck, enabling technicians to perform more work in less time. In fact, productivity studies conducted by fleets have found that installing a single vehicle lift in the shop can reduce labor overhead by $100,000 or more.”

According to Ken Atha, OSHA’s regional administrator in the West, “Workers in the automotive industry are exposed to crushing hazards from automotive lifts when servicing vehicles. These risks can be limited by properly maintaining automotive lifts and providing workers with effective training regarding inspection and use of lifts.”

“Safety starts at the top,” said R.W. “Bob” O’Gorman, president of the Automotive Lift Institute (ALI). “It begins with buying the right lift. Responsible managers know to only buy lifts that wear the gold label demonstrating that they have been third-party tested and certified to meet the ANSI safety and performance standard for lifts, ANSI/ALI ALCTV-2011.”

Lift Training and Inspection
After purchasing a lift, O’Gorman continued, “Next is training. It is very important that all technicians receive training on the proper use and maintenance of the lifts installed in the shop.”

Recognizing the need for such training, the National Conference of State Fleet Administrators recently asked Steve Perlstein, president of Mohawk Lifts, to prepare and present a webinar on vehicle lift safety. In his presentation, Perlstein pointed out that OSHA requires vehicle lifts to undergo annual inspections completed by experienced lift inspectors and that anyone using such equipment must receive training on an annual basis.

“Proper vehicle lift certification, installation and inspection have come under increased scrutiny in recent years by OSHA and other local, state, provincial, and federal health and safety officers,” O’Gorman said. “This has resulted in an increase in shops looking for qualified automotive lift inspectors.” Certified inspectors can be contacted through the ALI website (www.autolift.org).

All reputable lift manufacturers provide training on the proper use of their products when new equipment is installed in a fleet’s shop, and training also is available on their websites. Mohawk Lifts’ website (www.mohawklifts.com), for example, has several videos that include safety information about their lifts as well as information about other safety-related items available through the company.

With regard to management responsibilities relative to OSHA regulations, be aware that you won’t get a free pass because you don’t know about the regulations. Management has the responsibility to know the regulations and to follow them. As Perlstein noted in his webinar, there are two important standards fleet managers need to understand. The first is that lifts must be inspected annually by a qualified automotive lift inspector. The second is that the technicians who work on the lifts must be trained each year on how to safely and properly use them. Such training time must be documented by the fleet.

Research Product Specifications
While a vehicle lift offers a great opportunity to increase shop efficiency, it also opens up the fleet to liability for any injuries incurred by employees if the installed lift does not meet performance or manufacturing standards for the application.

According to ALI, purchasers of lifts often are confused by claims made by sellers. Such claims are sometimes made in good faith by inexperienced salespeople, but other times they may be made intentionally to confuse a potential purchaser and obtain an order for equipment that may not actually meet the purchaser’s requirements. Every lift in your shops should have an ALI/ETI certification label affixed to it, which will offer the assurance that the lift in question meets the current national safety standards.

Certification indicates that a third-party organization has determined that a manufacturer has the ability to produce a product that complies with a specific set of standards. Certified products undergo periodic re-evaluation and are required to be produced within the requirements of a documented quality program. The program is audited quarterly, regardless of the production facility’s location, to ensure continued compliance with the applicable standards.

“All lifts are not created equal,” Spiller said. “The best all-around lift for heavy-duty vehicle maintenance remains the modular in-ground lift. In-ground lifts have been the top choice of heavy-duty maintenance operations for more than 80 years because they provide the best access to maintenance items on a vehicle in the most ergonomic, space-efficient way.”

A lower price doesn’t necessarily mean that you’re getting a lift for less. Too often it means you’re getting less lift. You want a lift that delivers the lowest total cost of ownership. The most expensive lift you can buy is one that is out of service.

About the Author: Tom Gelinas is a U.S. Army veteran who spent nearly a decade as a physicist before joining Irving-Cloud Publishing Co. While at Irving-Cloud, he worked in various editorial capacities for several trade publications including Fleet Equipment, Heavy Duty Equipment Maintenance and Transport Technology Today. Gelinas is a founding member of Truck Writers of North America, a professional association, and a contributing writer for Utility Fleet Professional.

Dolce-1-Web

Replace, Rebuild or Repair?

How do you complete an economic analysis to cost-effectively determine whether to replace, rebuild, repair, sell or scrap vehicles and equipment? How do you ensure that your choice is the right one made at the right time, and that it supports your fleet’s tactical and strategic operating plans?

To start, you must assure yourself that your fleet’s vehicles and equipment being considered for replacement are fully utilized. If they’re not, instead of replacing them, think about reducing them from the fleet inventory and renting the units as needed. You can measure your fleet operation by laying out figures of activity-based costing to evaluate the facts, which will give you a picture of your fleet’s productivity and profitability.

Let’s look at an example of activity-based costing. The chart below shows the eight-year cumulative costs of an $18,500 light vehicle. The seven lines of the chart reflect the following:
• Line 1: Principal of $18,500 spread (depreciated) over five years.
• Line 2: Interest of 5 percent for the full principal in Year 1 and 5 percent interest for each year thereafter.
• Line 3: Annual parts and labor costs.
• Line 4: Estimated annual fuel costs.
• Line 5: Total costs of lines 1-4 divided by 15,000 miles for each year.
• Line 6: Resale value of the vehicle.
• Line 7: The resale value of each year divided into the maintenance cost.

Dolce-Illustration-1-Web

Note that the numbers in parentheses over Line 3 are the cumulative maintenance costs for each year. The first line of penciled-in numbers under Line 7 is the cumulative average of the maintenance cost divided by the resale value. The second penciled-in line is the average increase in maintenance cost divided by the resale value. This information turned out to be meaningless.

Time for Replacement
According to the industry best practice, it’s time to replace a vehicle or piece of equipment when the total maintenance cost of the unit being evaluated equals the total original purchase price. It’s also important to consider the unit’s reliability. For instance, in Year 8 the cumulative maintenance cost is $14,210, the maintenance cost is $6,200 and the vehicle’s residual value is $2,716. This vehicle is not reliable in its eighth year because it is often down for maintenance, plus it’s not available for use while it is being repaired. A low utilization rate costs your fleet an excessive amount of money.

It is desirable to give yourself enough time to be proactive in deciding when to replace a unit. You need time to propose its replacement and fund it with capital dollars to be accepted for your coming year, or fund it with operating dollars to rebuild it. If the unit is not needed, you need time to sell or scrap it.

Rebuilding is cost effective if you can spend half the cost of a new unit and get two-thirds to three-quarters the life of a new unit. For example, the $18,500 light vehicle’s cost-effective life cycle appears to be seven years, and it should be replaced at the end of its seventh year. If we were to consider a rebuild, half the cost of a new $21,000 vehicle would be $10,500, and its rebuilt expected life span would be five to six years.

In my experience, when a vehicle’s repair cost reaches 30 percent of its residual value, that gives you time to evaluate the vehicle to decide whether you want to replace, rebuild, repair, sell or scrap it. Costs for each alternative would be provided to management, and the capital and operating budgets should also be summarized. While a vehicle maintenance management information system would be very helpful with this, it’s not mandatory. You could set up a spreadsheet to start with and migrate to a management information system at a later date.

Vehicle Condition
Now, let’s deal with the condition of the vehicle. In this type of situation, it’s best to use numbers as descriptors instead of words so meanings are interpreted the same way by each person who reviews them.

Using a digital camera, take pictures of the fleet vehicles, capturing all four sides – front, rear, left side and right side. Next, assign numbers 1 through 5 to rate the vehicle’s condition. Five would be an excellent rating, 4 would be a very good rating and so on. Then, after you’ve made number assignments, identify components to rate, including the chassis, body, brakes and engine. Rate component sections so that each, added together, totals 100. This will allow you to rate the unit with 100 as the top score. Numbers lower than 100 indicate deficiencies for each vehicle.

Dolce-Illustration-2-Web

After rating each unit, prioritize each one being considered for replacement, rebuild or continued repair. The worst units should be prioritized first. Determine the capital and operating funding that fits your strategic company plan, as well as the tactical funding needed to support service levels for efficient availability and productive and reliable utilizations. If you watch duty and life cycles annually, some units, whose maintenance costs are at a starting point of 30 percent of their residual value, may be able to have their life extended because of good maintenance and operating methods.

The ultimate goal is to come up with an acceptable average age for all classes of your vehicles so you can monitor the entire fleet. Watch and pay attention to everything and measure what’s meaningful to support timely, proactive, cost-effective corrective actions.

About the Author: John Dolce is a fleet facility and maintenance specialist employed by Wendel Companies, an architectural and engineering firm. He is an active consultant, instructor and fleet manager with more than 40 years of experience in the public and private sector. Dolce has written three fleet-related textbooks and teaches fleet management courses at the University of Wisconsin’s Milwaukee and Madison campuses.

Tire Expenses: Manage to Minimize

Effective management of tire costs is more important now than ever and will continue to grow in importance, but if you are not able to accurately measure what your fleet spends on tires, there is no way you will be able to manage those expenses. Unfortunately, many fleets have not initiated a comprehensive tire management program, nor do they accurately know the expense they incur for tires.

“At the end of the day, it is cost per 1/32nd of tread wear per mile, but most people do not have that information,” said Darry Stuart, president and CEO of DWS Fleet Management Services (www.darrystuart.com). “The best way to accurately account for tires is to use a good computerized system and charge tires by 32nds as they go on and credit tires the 32nds when they come off. Also, most fleets include the cost of tires in the cost of a new truck, therefore failing to include those tires when they are calculating their tire cost per mile.”

Programs that do this kind of accounting are available and have been designed to interact seamlessly with most computerized maintenance management systems. Services are also available through tire vendors who will input fleet tire data, then store and analyze it. Goodyear (www.goodyear.com), for example, recently launched a next-generation version of its TVTrack program that is designed to do exactly what needs to be done if fleet tire costs are to be managed. It is available through the company’s dealer network and will accept and analyze cradle-to-grave financial information about any brand of tire.

Retreads
Retread tires deserve to be included in all commercial fleet tire programs. Many fleets operating Class 3 through 6 vehicles already use retreads, and due to economic pressures over the last few years, there has been a growing interest in the use of these products among fleets not using them. “There has definitely been an increased interest in using retreads,” said Guy Walenga, director of engineering for commercial products at Bridgestone Firestone (www.bridgestone-firestone.com). “You could say people have found religion. They have been looking for any place where they can save some money. Many fleets that never considered retreading before have taken another look at the use of retreads because it is such a good way to influence the overall cost per mile.”

Fleet managers need to realize there is no definite age limit on the life of a tire carcass. Steel body plies and steel-belted commercial tires are designed to be retreaded. Every casing that goes into a reputable retread shop will be inspected visually and with a nondestructive testing system that will find any nail holes invisible to the naked eye. They are also put through X-ray tests to find ply separations.

“Because each tire casing goes through this extended inspection process, there is no time frame that would limit the casing for retreading,” Walenga said. “A retreader is liable for the quality and performance of his product. As a result, he’s not going to put a dime of unnecessary expense into a tire that isn’t going to retread and perform for his customer. He does all of his testing before he buffs the tire.”

The high cost of tires has caused an increased interest in recapping in heavy-duty fleets that had not taken advantage of this proven technology. Fleets that regularly use recapped tires are looking to get another cap or two on their casings. Many fleet managers recapped a casing only until it was about 5 years old, and then sold it instead of capping it again.

That strategy is changing. “Some years ago, most fleet managers would take a casing out of service after about five years,” Stuart said. “That increased to six years and now, in many cases, is at seven years and in some cases eight years. The strategy has been working well, but the applications those older casings go into need to be managed. If the tire is going to be used in a low-mileage trailer application, 40,000 or 50,000 miles a year, it will very likely offer you no problems. Capping technology has also improved, helping to make this strategy possible.”

Ryder System (www.ryder.com) has a policy of not going down to the legal limit for its over-the-road units. “The DOT legal is 2/32, but we target 4/32, which gives us a little bit of room to plan the replacement,” said Scott Perry, Ryder’s vice president of supply management. “We recognize the importance of the casing and not wearing the tread package too thin. Our customers are on full-service leases so they will bring their trucks into our service facilities on a regular basis, and our goal is to perform as much of the required maintenance on our leased vehicles at our facilities as possible. As a result, we have multiple touch points throughout the year. Because of that, we can predict when the tires will need to be removed from the vehicle.” Consequently, it’s a scheduled procedure and not a road call.

Air Pressure
Inflation pressure is always the most important factor of tire maintenance relative to tire costs. Correct inflation will help to maximize a casing’s retreadability while minimizing wear and the tire’s negative contribution to fuel economy rolling resistance. “If you don’t have the right air pressure, you’re giving up tread mileage, giving up casing durability and you’re giving up fuel economy,” Walenga said. “A casing can be destroyed if it is run at the wrong air pressure.”

Tires will always be an expensive commodity for fleets, so it makes sense to do everything you can to control costs. Maximize the life of every casing, and when a tire comes out of service, make sure you know why. Use retreads. Keep tires aired to the correct pressure. If you’re not doing this, you’re wasting money.

About the Author: Tom Gelinas is a U.S. Army veteran who spent nearly a decade as a physicist before joining Irving-Cloud Publishing Co. While at Irving-Cloud, he worked in various editorial capacities for several trade publications including Fleet Equipment, Heavy Duty Equipment Maintenance and Transport Technology Today. Gelinas is a founding member of Truck Writers of North America, a professional association, and a contributing writer for Utility Fleet Professional.

Dolce-1-Web

Measuring Your Fleet Operation

In order for us to measure our fleet operation, we need to lay out numbers that illustrate our activity via activity-based costing. This gives us a picture of what is happening in terms of our fleet productivity and resultant profitability. The photo seen below is an excellent example of basic information that doesn’t make sense until it is explained, which is one way activity-based costing can assist your fleet. If we put our finger on the number 1 in the photo, we then look sequentially for 2, then 3 and so on.

Try this exercise: Give yourself 30 seconds and see how far you get sequentially during that time. After the 30 seconds is up, determine the number you achieved. Look at the sheet – how are the numbers laid out? Draw an imaginary line down the middle of the sheet. Note that odd numbers are on the left side; even numbers are on the right. Knowing this layout pattern, if we do the exercise a second time, we will focus on a 4-inch-by-10-inch layout rather than an 8-inch-by-10-inch layout. That should increase our productivity by 50 percent. Now, repeat the exercise and measure your productivity improvement.

Case Study Review
Next, review the case study below. Let’s go through the 22 line items to lay out the condition of this fleet. These categories will give us a picture of our fleet and its productivity. I’ll explain the meanings of each line item and, after that’s done, we can look at the overall condition illustrated by these categories and the numbered value for each line item.

Dolce-2-V2-Web

Column 2, Line 1 shows we have 421 vehicles. Line 2 states the total operating expenses are $119,000 for the month of January. In Line 3, you can see the operating dollars budgeted for the month are $90,000. Line 4 highlights an important point – that we are 32 percent over the operating budget for the month. Since we spent it, we have to get the extra spent money from somewhere. The money could come from another department’s savings or an advance from next month’s budgeted items, or it could be borrowed from a lender.

Line 5 indicates that our actual cost-per-mile average for our 421-unit fleet is 82 cents. In Line 6, you can see that our budgeted cost per mile for this month is 64 cents. Based on those figures, we are 18 cents per mile over our operating budgeted mileage cost. Line 7 shows that our fully burdened labor rate is $83.12 per hour. That includes direct labor plus benefits and all overhead such as heat, electric, supervision and clerical costs. This tells us that if an outside organization can do our maintenance and repair work for less than this number, they should be hired. Our shuttle time also needs to be included in the analysis.

Line 8 notes that direct labor is approximately $53 per hour, so if we pay our staff $15 dollars per hour for 2,080 hours per year (52 weeks x 40 hours per week), a third of that time is spent working on maintenance and repair tasks. Line 9 tells us 320 of the 421 vehicles are power units; the remaining 101 units are nonpower. In Line 10, you can see that the average age of the 421 units is 8.2 years. According to Line 11, 185,000 miles were accumulated for the month. We want that number to stay high because those are revenue miles that deliver our product and thus make money for the company.

Line 12 tells us that on average, 75 percent of the 421 vehicles are operating day to day, while 25 percent are not used. Line 13 indicates that each of the 421 vehicles averaged 579 miles this month (185,000 ÷ 421). However, if you divide 185,000 by 421, that equals 439, not 579. Don’t presume all your numbers are always correct; before you accept their accuracy, test the numbers and believe nothing until you have verified their integrity.

Line 14 shows that, of the 75 percent of the vehicles in operation, 15 percent are down. That means a net of 60 percent of the 421 vehicles are running; the other 40 percent are not running and probably are not needed. Line 15 tells us there is a 20 percent backlog of work waiting to be done, which indicates that the backup is excessive. There is a road call every 2,500 miles based on the information in Line 16. As we address our problems, we want this number to increase to validate our maintenance and repair efficiencies.

In Line 17, you can see that there are 35 staff members. Preventive maintenance (Line 18) is 10 percent of our workload, and scheduled work (Line 19) accounts for 35 percent. Line 20 tells us our parts and materials inventory is increasing 10 percent each month. According to Line 21, we’re taking in 20 percent more than we issue, which is one reason why our parts and materials are increasing 10 percent per month. Line 22 lets us know that we are ordering more than we need, supporting the fact that our parts and materials inventory is increasing 10 percent more than we need each month.

Corrective Actions
Now, what’s wrong here? We’re 32 percent over budget, but there are three activity-based numbers that tell us what to do to help correct our situation:
1. Forty percent of our vehicles are not needed. If we remove 100+ unneeded vehicles, the fixed costs of these vehicles will reduce our expenses.
2. Hopefully, most of these targeted reductions will be our power vehicles, which are more costly to own and operate than nonpower vehicles.
3. The third pertinent number is the average vehicle age. We want to remove older units since they are the most costly and least reliable.

Column 3 Review
Let’s review Column 3 to follow up on our corrective actions. We removed 56 vehicles from the 421 units, leaving 365 total units – a 13 percent reduction. Depending on your expertise and experience, some of you will remove 35 to 40 percent or whatever you’re comfortable with. That is fine, too.

Line 2 indicates expenses have dropped from $119,000 in January to $109,000 in April based on the reduction in vehicles, and in Line 3 you can see that the operating budget has been lowered an estimated $8,000. Line 4 shows that we’re still 33 percent over budget, but we’ll catch up next month – we have to reduce our budget for our reduced fleet. In Line 5, note that the actual cost per mile has gone down 2 cents, while Line 6 shows the planned cost per mile is steady.

The fully burdened labor rate has now dropped $1.02 per hour (Line 7) and direct labor is down 63 cents per hour (Line 8). In Line 9, note that power units are down by 43. Thirteen units are nonpower, which is good because power units are more expensive than nonpower units.

In Line 10, you can see the average age has dropped 1.5 years. That signifies the majority of the 56 units removed were older units. In Line 11, the revenue miles are holding relatively steady, so we’re not negatively impacting revenue. The percentage operated (Line 12) has increased 9 percent. More of our vehicles are being used, but we have more units to remove. Of 40 percent, 13 percent have been cleared out, so we have 27 percent to go. Usage per unit (Line 13) has risen from 579 miles (after testing the numbers, this should actually be 439 miles) to 650 miles. You will notice in Line 14 that downtime is still a problem; we need to take the time to prioritize and sequence our workload. However, backlog (Line 15) is down 10 percent, a positive event.

Road calls, per Line 16, now occur every 2,800 miles, a step in the right direction. Since a reduction in work requires fewer staff members, we are down two people since January (Line 17) who have hopefully been reassigned within the company. Line 18 shows that preventive maintenance is up from 10 percent to 30 percent of our workload. Scheduled work (Line 19) remains steady. Because Lines 20, 21 and 22 have not moved, we have to get the parts people up to speed. The fleet reductions are reducing the average age of the fleet, thus requiring fewer parts.

All in all, the numbers are falling in line with our corrective action. There are many problems that are responding to one corrective action – reducing the fleet by getting rid of older vehicles, thereby lowering the fleet’s average age.

Post-Audit Action Items
Generally, when an operational audit is completed, the following are common items that require corrective action. These items are listed in order of priority.
• Written policies and procedures are needed.
• Work standards and productivity measures are needed.
• Fleet size is too large.
• Management practices need improvement.
• Utilization and availability criteria are needed.
• Supervisors need training in participatory methodology.
• Communication upgrade on each level is needed.
• Quality must improve.
• Vehicle purchasing and procurement procedures need improvement.
• Transportation organizations need to look at centralization and decentralization strategies.
• Work scheduling needs to be quantified and upgraded based on frequencies, time, mileage and fuel use.
• Technical training is needed.
• Management by objectives needs to be implemented and upgraded.
• Look at in-house and outsource maintenance balance.
• Cost control systems need to be established and implemented.

About the Author: John Dolce is a fleet facility and maintenance specialist employed by Wendel Companies, an architectural and engineering firm. He is an active consultant, instructor and fleet manager with more than 40 years of experience in the public and private sector. Dolce has written three fleet-related textbooks and teaches fleet management courses at the University of Wisconsin’s Milwaukee and Madison campuses.

Ford-F-650-Web

Gas vs. Diesel in Utility Fleet Applications – Which is Better?

A decade ago, the choice between gasoline and diesel engines in most Class 3 to 7 truck applications was a no-brainer – diesel, of course. At that time there were few gasoline engine options available in heavier trucks and diesel held a significant advantage in terms of fuel efficiency, low-end torque and longevity, for only $3,000 to $4,000 more up front.

Today, however, the decision is a bit more complex. New gasoline engine technology has begun to narrow the fuel-economy and performance gap with diesel. And after progressively stringent federal emissions standards for diesel engines were put into effect in 2004, 2007 and 2010, requiring expensive exhaust reduction technologies, the price gap has essentially doubled, with diesel engines costing about $7,000 to $10,000 more than a comparable gas-burner, causing utility fleet managers to take a hard, second look at gas, when it’s available.

So, in instances where both gas and diesel are available in a particular class truck, which is better for utility and telecom fleets? Utility Fleet Professional spoke with experts at GE Capital Fleet Services (www.gefleet.com) and Donlen (www.donlen.com) to get their take. Here are the criteria they recommend when deciding between gas versus diesel.

When Diesel is Better
Despite the substantially higher price tag, when does diesel make the most sense from a performance and life-cycle cost perspective?

“When the fleet expects the truck to run longer periods of idling time powering auxiliary equipment, they tend to lean towards diesel,” said Ken Gillies, manager of truck ordering and engineering at GE Capital Fleet Services, a leading full-service fleet management company based in Eden Prairie, Minn. “Also when there’s heavy towing necessary, they’ll choose diesel because of the engine’s higher torque output.”

Steve Jansen, manager, fleet services and regulatory compliance at Donlen, a full-service fleet management company based in Northbrook, Ill., and wholly owned subsidiary of The Hertz Corp. (NYSE: HTZ), agreed. “If you’re taking a [Ford] F-550, and you’re putting on some sort of small crane or bucket truck or you’re going to do some high-wire stuff, you’re probably not even going to think about gas. You’ll jump into diesel because it’s going to give you the torque you’re going to need and the longer life,” Jansen explained. “The torque is important to get you up and down the road with the weight you’re pulling. And if you’re taking the truck off-road into brush or something like that, you’re going to need a lot of low-end torque of the diesel to help drive the truck out of those situations.”

What’s the difference in life expectancy between diesel and gasoline engines?

“I’m still a firm believer that gas engines are built to go 200,000 miles. Diesel life is in the 300,000 to 350,000 to almost 400,000 miles range, depending on the size truck and application,” Jansen said.

According to Gillies, another factor that drives diesel selection is fuel economy. “Although the gasoline world has done a great job with efficiencies for fuel injection and various controls, diesel still holds a miles per gallon advantage, which we see as a way to help fleets control fuel costs in high-mileage, high-idle situations,” Gillies said.

What exactly is diesel’s fuel economy advantage?

“The diesel is 15 to 20 percent more fuel efficient than gas,” Jansen said. “And even though the gasoline engines have improved, the one thing that remains the same is that the diesel fuel itself is still 30 to 35 percent more efficient than gasoline [in terms of energy density]. So, theoretically, for every gallon of diesel fuel you put in, you’re having to put in 1.3 gallons of gasoline because of the efficiency ratio.”

Gillies estimated the diesel advantage at about 2 mpg, but said that at that rate, “it still takes a long time to clear the higher [initial] cost of the diesel engine, depending on the specifics of the application and the actual road mileage the vehicle is encountering.”

When Gas is Better
In what utility fleet applications is gasoline a good fit?

“A gas engine is suitable in a light utilization vehicle,” Gillies said. “By that I mean light-duty Class 2 to 3 and, in some cases, Class 4, when it’s operating with relatively short idle time. The diesel starts to make more sense if the application requires longer idle time [to operate cranes, buckets and other specialty equipment], even if it’s a lighter-class truck.”

Also, if the fleet is considering converting vehicles to gaseous alternative fuels such as CNG or propane autogas, a gasoline engine would be the most economical option because it’s inherently more “gaseous-fuel ready” than diesel, according to Gillies. “It’s about a $9,000 or so conversion cost to equip a gasoline-powered Class 6 truck for CNG. If you take the same truck, spec’d with a diesel engine, and you want to convert it to gaseous fuel, you’re looking at, on average, three times the cost,” Gillies said.

The Bottom Line
Jansen summed up the gas versus diesel deliberation this way: “The whole decision is based on what the job is you’re going to call on that truck to do. If it’s running from job site to job site to check on workers or as an estimator, carrying a small amount of tools or equipment going out to inspect well sites, then gas is going to be fine. The heavier the job, that’s where diesel is really going to pay off, giving you the long life and low-end torque and start-ability you need to drive that truck out of a ditch, whereas the gas [engine] is going to struggle a little bit in that scenario.”

About the Author: Sean M. Lyden is a nationally recognized journalist and feature writer for a wide range of automotive and trucking trade publications, covering fleet management strategies, light- and medium-duty trucks, truck bodies and equipment, and green fuel technologies. He blogs at Lyden Fleet Strategies (www.lydenfleetstrategies.blogspot.com).

IPL-5-Web

Valuable Insight

For the Facilities & Transportation Fleet team at Indianapolis Power & Light Co., the key to productivity and efficiency is not just the programs and technologies that have been put in place. Equally important and absolutely essential, they note, is to ingrain a process of organizational efficiency throughout the culture of the operation.

Keith Dunkel, team leader and fleet manager, Kim Garner, fleet administration, and Les Gose, fleet maintenance at IPL, all point to the successful implementation of the 5S methodology within the fleet maintenance operation. This workplace organization methodology, based on five Japanese words all beginning with the letter “S” when translated into English (Sort, Set in Order, Shine, Standardize and Sustain), has benefited the fleet’s maintenance shops through improved organization of work spaces.

“A primary focus was on the efficient and effective storage of work tools and supplies, maintaining the work area and these items, and sustaining the new order,” Dunkel said. “The decision-making process usually comes from a dialogue about standardization, which builds understanding among employees of how their work should be done.”

At IPL, the 5S methodology has brought a new cultural mindset to shop floor efficiency and safety within the fleet maintenance operation. “It’s a process that builds collaboration among employees and management specific to work design and flow,” Dunkel stated. “In addition to improving shop safety by reducing hazards, it has also provided structure within the shop environment to identify and reduce waste.”

Today, IPL crew leaders, technicians and management personnel use the 5S methodology to effectively run shop operations. A weekly safety walk, for example, is used to identify housekeeping issues, such as defective lighting or other concerns, based on a comprehensive checklist of items specific to the operation and environment.

Organized Approach
An organized approach is also in place in other areas of the IPL fleet and maintenance operation. “Three years ago,” explained Gose, “we brought in NAPA to manage our parts system. NAPA now operates our parts room as a private store, staffed 16 hours per day. The facility exclusively serves the IPL fleet, handles paperwork for our business with a local tire vendor, and as an added convenience, IPL employees can make purchases for personal use.

“With this arrangement,” Gose continued, “we are ensured competitive pricing within a consigned parts format. This has given us access to a substantial inventory without tying up financial resources for owned inventory.”

Gose also explained that IPL and NAPA are working closely together to ensure that the parts supplier is prepared to provide the wide variety of standard and specialized items needed for utility vehicles. “Our initiative is to ensure that NAPA understands our needs,” he said. “We do not want to wait for parts that we should have in stock and we expect NAPA to adjust the consignment inventory as our specs change.

“We have established and track metrics specifically to the NAPA operation,” Gose continued. “Those target wait times, fill rates and inventory location accuracy. We believe these to be core competencies for parts management and are integral to the productivity of our technicians.”

The IPL fleet is serviced in two locations, Dunkel noted. “At our main hub in Indianapolis we house about 80 percent of the fleet of 422 vehicles,” he related. “At a satellite facility we handle the other 20 percent. About 80 percent of the fleet is used in operations across our 528-square-mile service territory and the rest is allocated to our three generating plants.”

Meeting Needs
The composition of IPL’s fleet is designed to meet the needs of field operations that maintain 835 circuit miles of transmission lines and approximately 12,668 circuit miles of distribution lines, as well as 144 substations. A total of 88 heavy-duty units account for 20 percent of the fleet, another 92 are medium-duty models and the balance consists of 242 light-duty vehicles.

Primary makes represented in the IPL fleet include International heavy-duty, Freightliner and Ford medium-duty, and Chevrolet and Ford light-duty models. IPL’s alternative fuel vehicles are primarily within the light-duty segment of the fleet and use E85 from a central fueling station.

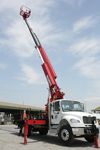
Vehicle types at IPL are varied for line, substation maintenance and construction needs, Dunkel pointed out. Aerial units supplied mainly by Altec include 45-foot models for trouble trucks, 55-foot models for line truck material handlers, 85-foot high reach noninsulated and 125-foot insulated units, and there are 42-foot material handlers and articulating squirt booms.

Also in operation at IPL are digger derricks, light-duty cranes, cable pullers and rodders. Truck types include step and hi-cube vans, 3/4-ton vans, and 1/4-, 1/2-, 3/4- and 1-ton pickups. The fleet also has sedans, minivans and SUVs, and the maintenance staff services and repairs support equipment such as easement rigs, backyard buckets, tensioners, wire reel trailers, forklifts, backhoes and small excavators.

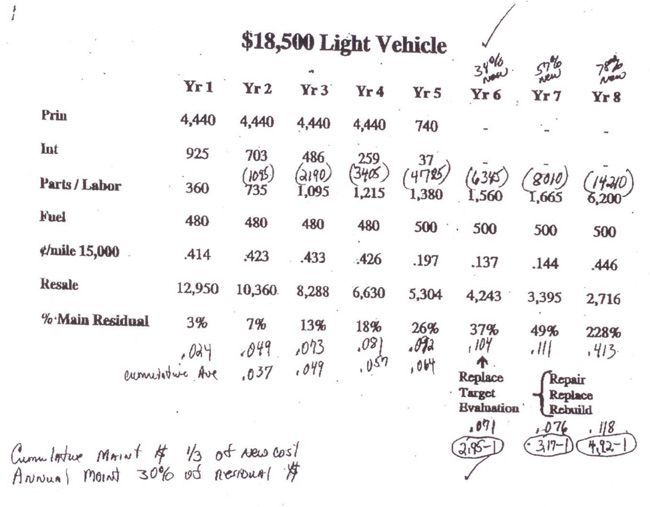
“We have established replacement cycles based on vehicle size and use,” Garner said. “Light-duty models are in service for five years or 60,000 miles, trouble trucks are replaced after seven years and line trucks see 10 years of service in our fleet.

“For remarketing our retired heavy-duty trucks, and some nonroad equipment, we have been using the services of J.J. Kane Auctioneers,” Garner related. “We were working with a local auction company, but Altec brought J.J. Kane to our attention because of their specialization in selling construction utility equipment.

“They know the markets where we can get the best resale value for our trucks,” Garner added. “Overall, it’s been a very smooth and effective process. We have maximized our recovery dollars using the J.J. Kane process.”

Software is also in place to help specify and manage the IPL fleet, Gose noted. For example, there’s Diamond Logic Builder at International Trucks’ Body Builder Resource Center, as well as the CFAW fleet maintenance management solution and E.J. Ward automated fuel management software and reporting tools.

In the shop, Gose reported, technicians are trained on a regular basis and have multiple diagnostic tools at their disposal. Included are the Rotunda (IDS) service tool for Ford vehicles, Mentor, Pegasus, INSITE (Cummins) and Tech II diagnostic equipment, and the ServiceMaxx diagnostic and programming tool for Navistar MaxxForce engines.

Accelerated Implementation
“In 2010, we started using the Telogis Fleet management solution for vehicle telematics,” Dunkel said. “Initially, we phased in 50 trucks, but once we experienced the wealth of the data available, we accelerated our implementation plan.

“By the end of the first year we had over 300 vehicles on the system,” Dunkel continued. “The telematics solution reports GPS location data, engine performance, idle, PTO and battery time, and odometer readings, along with hard braking and acceleration information.

“Now that we have over two full years of baseline data from vehicle electronics systems over the Telogis solution, we’re taking it to the next level,” Dunkel added. “We have completed the next step [Enterprise Level] using the system’s InSight Alerts function to develop driver scorecards and a [key performance indicators] Dashboard.

“With these capabilities,” Dunkel stated, “our field operation teams use the system to enhance productivity by determining arrival and departure times at job sites. In the fleet department, we will be able to model scenarios that will show us the impact on costs of reducing idle time and get alerts to mechanical conditions previewing potential costly breakdowns and repairs.”

IPL’s management team, Dunkel added, has given strong support for this investment in vehicle telematics. “This technology has provided new and valuable insights into how our trucks are used,” he said, “giving us opportunities to lower operating costs, improve driving behaviors and better manage our assets.”

About IPL: Indianapolis Power & Light Co. provides retail electric service to more than 470,000 residential, commercial and industrial customers in Indianapolis, as well as portions of other central Indiana communities surrounding Marion County. During its long history, IPL has supplied its customers with some of the lowest-cost, most reliable power in the country. Its parent company, AES Corp., provides affordable, sustainable energy to 25 countries through a diverse portfolio of distribution and generation businesses.

About the Author: Seth Skydel has more than 27 years of truck- and automotive-related publication experience. In his career, he has held editorial roles at numerous national business-to-business publications focusing on fleet and transportation management, vehicle and information technology, and industry trends and issues.

Changing Brakes

A primary concern of every fleet professional is the safe operation and stopping ability of the vehicles in his fleet. A truck’s ability to stop, of course, depends on the condition and quality of its braking system, particularly its brakes’ friction material. The friction material used in truck brakes has changed a great deal over the last few decades and continues to change. As an integral part of the braking system, friction material must be chosen to provide the stopping power necessary in a truck’s specific application. This is especially true for commercial vehicles since any given truck model may be put into a wide range of applications. Light-duty vehicles, however, may well benefit from the use of other-than-normal friction material. Consider, for example, police cruisers that may be used in high-speed pursuits with heavy braking demands.

Replacing Asbestos
Years ago, asbestos friction material was commonly used in vehicle braking systems – commercial trucks in particular – because of its ability to withstand the high operating temperatures that could be generated in stopping a heavy vehicle. Indeed, temperatures more than 2,000 F created a substantial fire hazard. The health hazards of asbestos, however, have all but eliminated its use in friction materials intended for vehicle applications. Although domestic manufacturers claim that asbestos materials are no longer used in friction products, foreign manufacturers of aftermarket brake parts have no requirement to stop distributing asbestos friction material. OSHA regulates the amount of asbestos dust that is present in vehicle repair facilities, which is where potential problems are found.

Ceramic or non-asbestos organic friction materials were developed to replace asbestos-based products in specific applications. These materials typically exhibit low friction and/or unacceptable wear rates at high temperatures and are very useful in light-duty applications, but are not suitable in many commercial and most heavy-duty operations.

Semi-metallic material was developed, along with ceramic material, to replace asbestos. In comparing the two, Kevin Judge, sales manager of national accounts at Fras-le (http://nabrakes.fras-le.com), a major manufacturer of semi-metallic and ceramic friction material, said, “Semi-metallic material is a bit more aggressive, but can be more noisy than ceramic material. The performance, however, of semi-metallic material makes it a desirable product for use in trucks as well as automobiles used in applications that need high-performance braking performance. It has become the standard for use by the trucking industry.”

More Changes Coming
As a result of environmental concerns, two states have passed legislation that nearly eliminates the use of copper, in addition to several other materials, in friction material. Three years ago, both California and Washington passed laws mandating that friction material used in brakes contain no more than 0.5 percent of copper by weight. While various portions of the laws take effect at different times, they have spurred the industry to develop compliant materials that will deliver satisfactory stopping performance. “As an industry, we are being challenged in going copper-free after 2019,” Judge said.

Not surprisingly, these laws put additional financial burdens on manufacturers and distributors. They may well be enough to cause some suppliers to leave the business, resulting in fewer product choices for fleets.

Brake Repairs
While fleet managers seek a long service life from brakes, they also know that brake pads and blocks will wear out and need to be replaced. Be sure to do your homework before you go to market. “Fleet managers should be prepared to accurately describe their fleet’s applications when they go to market to purchase replacement brake pads or brake linings,” Judge said. “Terrain is important. The hills of Pittsburgh require different material than the flatlands in Des Moines. They should be aware of the load that they’re carrying. Is it a constant load? Is going to be variable? Is it going to be loaded off and on? Will the application be stop-and-go, or will it be over-the-road? This is the kind of information that brake service technicians need to know before they can make good recommendations regarding friction material.”

If you plan on making a change in friction material of replacement pads or liners, test the material before making a purchase. It’s not unreasonable for a fleet manager to request sample material for his own tests. Judge said that he often gets asked for samples. Tim Bauer, director for undercarriage products at Meritor Aftermarket (www.meritor.com), concurs. “Always test the friction material you’re considering purchasing,” he said. “Look at long-term replacement [cost versus price]. Be wary of container loads of low-price friction. Do they meet safety standards like FMVSS 121? What kind of warranty is offered? Who will back you up in the case of a failure or other problems?”

Bauer also urges that you never replace or service a component on one wheel end only; always do both wheel ends. This is especially true for work on front axles. In addition, if hardware comes packaged with replacement brake pads or linings, use it. “Don’t forget your hardware works just as hard as the linings,” Judge said.

Anytime a technician pulls a wheel, have him measure the thickness of the pad or lining as well as the run-out of the rotor or drum. Have him inspect the hoses to make sure they’re not worn or frayed, and ask him to check all the hardware to ensure it’s in good shape.

Because friction material is just one piece of a very important system comprised of parts designed to work together, when it comes time to replace it due to wear, it should be replaced with material that is as close to original as is possible or with material that you have tested to ensure satisfactory operation in your application.

About the Author: Tom Gelinas is a U.S. Army veteran who spent nearly a decade as a physicist before joining Irving-Cloud Publishing Co. While at Irving-Cloud, he worked in various editorial capacities for several trade publications including Fleet Equipment, Heavy Duty Equipment Maintenance and Transport Technology Today. Gelinas is a founding member of Truck Writers of North America, a professional association, and a contributing writer for Utility Fleet Professional.

Sharing Ideas

Industry events are all about sharing information and ideas and this year’s Electric Utility Fleet Managers Conference (www.eufmc.com) was no exception. Held in June, the annual conference celebrated its 60th anniversary with a mix of networking opportunities and a host of technical sessions that focused on the latest utility fleet management techniques and technologies.

The keynote address at EUFMC this year was delivered by Greg Pruett, senior vice president of corporate affairs for PG&E Corp. and Pacific Gas and Electric Co. In his remarks, Pruett focused in large part on electric vehicles, a subject we continue to follow at UFP as well.

PG&E, which has a long history of incorporating efficient and sustainable transportation technologies, today has more than 3,400 alternative fuel models in its fleet. Included are electric, natural gas and hybrid vehicles. The company is also working with aerial device suppliers to develop and test plug-in battery-powered systems and is deploying extended-range electric trucks, plug-in hybrid material handlers and all-electric service body units. To support these new vehicles, PG&E has installed more than 80 electric vehicle charging stations.

“We have also worked to develop customized lease terms that take into account the life cycle of electric vehicles,” Pruett noted. “We believe that other utilities can take advantage of these opportunities as well. Collectively, when it comes to the electrification of transportation, the utility industry has an incredible opportunity to be a game changer across the U.S.”

Among the topics on the 2013 EUFMC agenda were electric PTOs, a regulatory update, safety, fuel, boom inspections and technology in fleet garages. In addition, roundtable sessions for fleet managers and suppliers covered common challenges and the sharing of best practices.

One presentation at EUFMC that attracted a lot of attention was a report regarding a recently concluded survey on key process indicators (KPI). Mike Allison, director at Duke Energy, provided an overview of results; full details will be available in the future.

The KPI Survey, conducted in April by Utilimarc, is the second annual survey commissioned by EUFMC. In 2012, the conference presented results of its PM Practices & Technician Training Survey. For 2013, the focus was on the measures fleets are using to gauge the effectiveness of their management strategies.

Included were metrics in place to monitor vehicle availability, such as downtime and mean time between repairs, budget compliance, costs, fuel consumption, mechanic time, preventive maintenance, safety and a number of other areas. In each case, survey respondents ranked individual KPIs in different categories and reported on how the metrics help make more effective business decisions.

A new idea introduced at EUFMC that also promotes the sharing of information was the recently unveiled MechanicsQA. Offered by FleetAnswers, the forum allows technicians to “reach out to other fleet mechanics at a job specific level to ask questions and provide answers” in a collaborative setting. The forum, which has been undergoing testing at fleets, will eventually include a searchable database and other capabilities. Access to the free forum is available at www.mechanicsqa.com.

“Fleet is the backbone of our industry,” Pruett told the more than 100 fleet professionals at EUFMC. “We cannot serve our customers without it and in many cases our fleet is the main contact our customers have with us. It’s essential that we field vehicles that are as safe, clean and reliable as the electricity we provide. Your role as leaders is not static. It is rapidly changing and increasingly important.”

For the 2013 EUFMC audience, that message was not a surprise. Founded in 1953, the association has been educating fleet professionals for six decades, proving that there is no better venue for sharing ideas and best practices.

Seth Skydel
Editor

Utility Fleet Professional

360 Memorial Drive, Suite 10, Crystal Lake, IL 60014 | 815.459.1796

KNOWLEDGE, INSIGHT & STRATEGY FOR UTILITY FLEET LEADERS

Utility Fleet Professional is produced by Utility Business Media, Inc.   View Capabilities Statement

Get the Utility Fleet Professional Digital Edition App

Get the iP Digital Edition App


© All rights reserved.
Back to Top